Debugging Go in Intellij IDEA / GoLand
Recently me and a friend were trying to debug a stackoverflow error in helm. We used a lot of print statements in the code and were reading the code and seeing the flow and checking where it just blew up. At some point I realized we were putting lot of print statements and it was just becoming tedious to follow along the big code - it was some parsing code 😓 to parse the command line values. And we were working in one of the most powerful IDEs - Intellij IDEA. And I was like “let’s just use the power of the IDE for debugging!” and I searched online and found how to do it. We just had to create a configuration. Here are the steps that we followed :
Prerequisite - Make sure you have a Golang plugin installed in Intellij IDEA or you are in GoLand. The below steps are accurate for Intellij IDEA. For GoLand, it looks quite similar, you can check the goland blog at the end.
Steps:
In the top right, there will be a drop down to see the list of configurations

Use edit configurations in the drop down

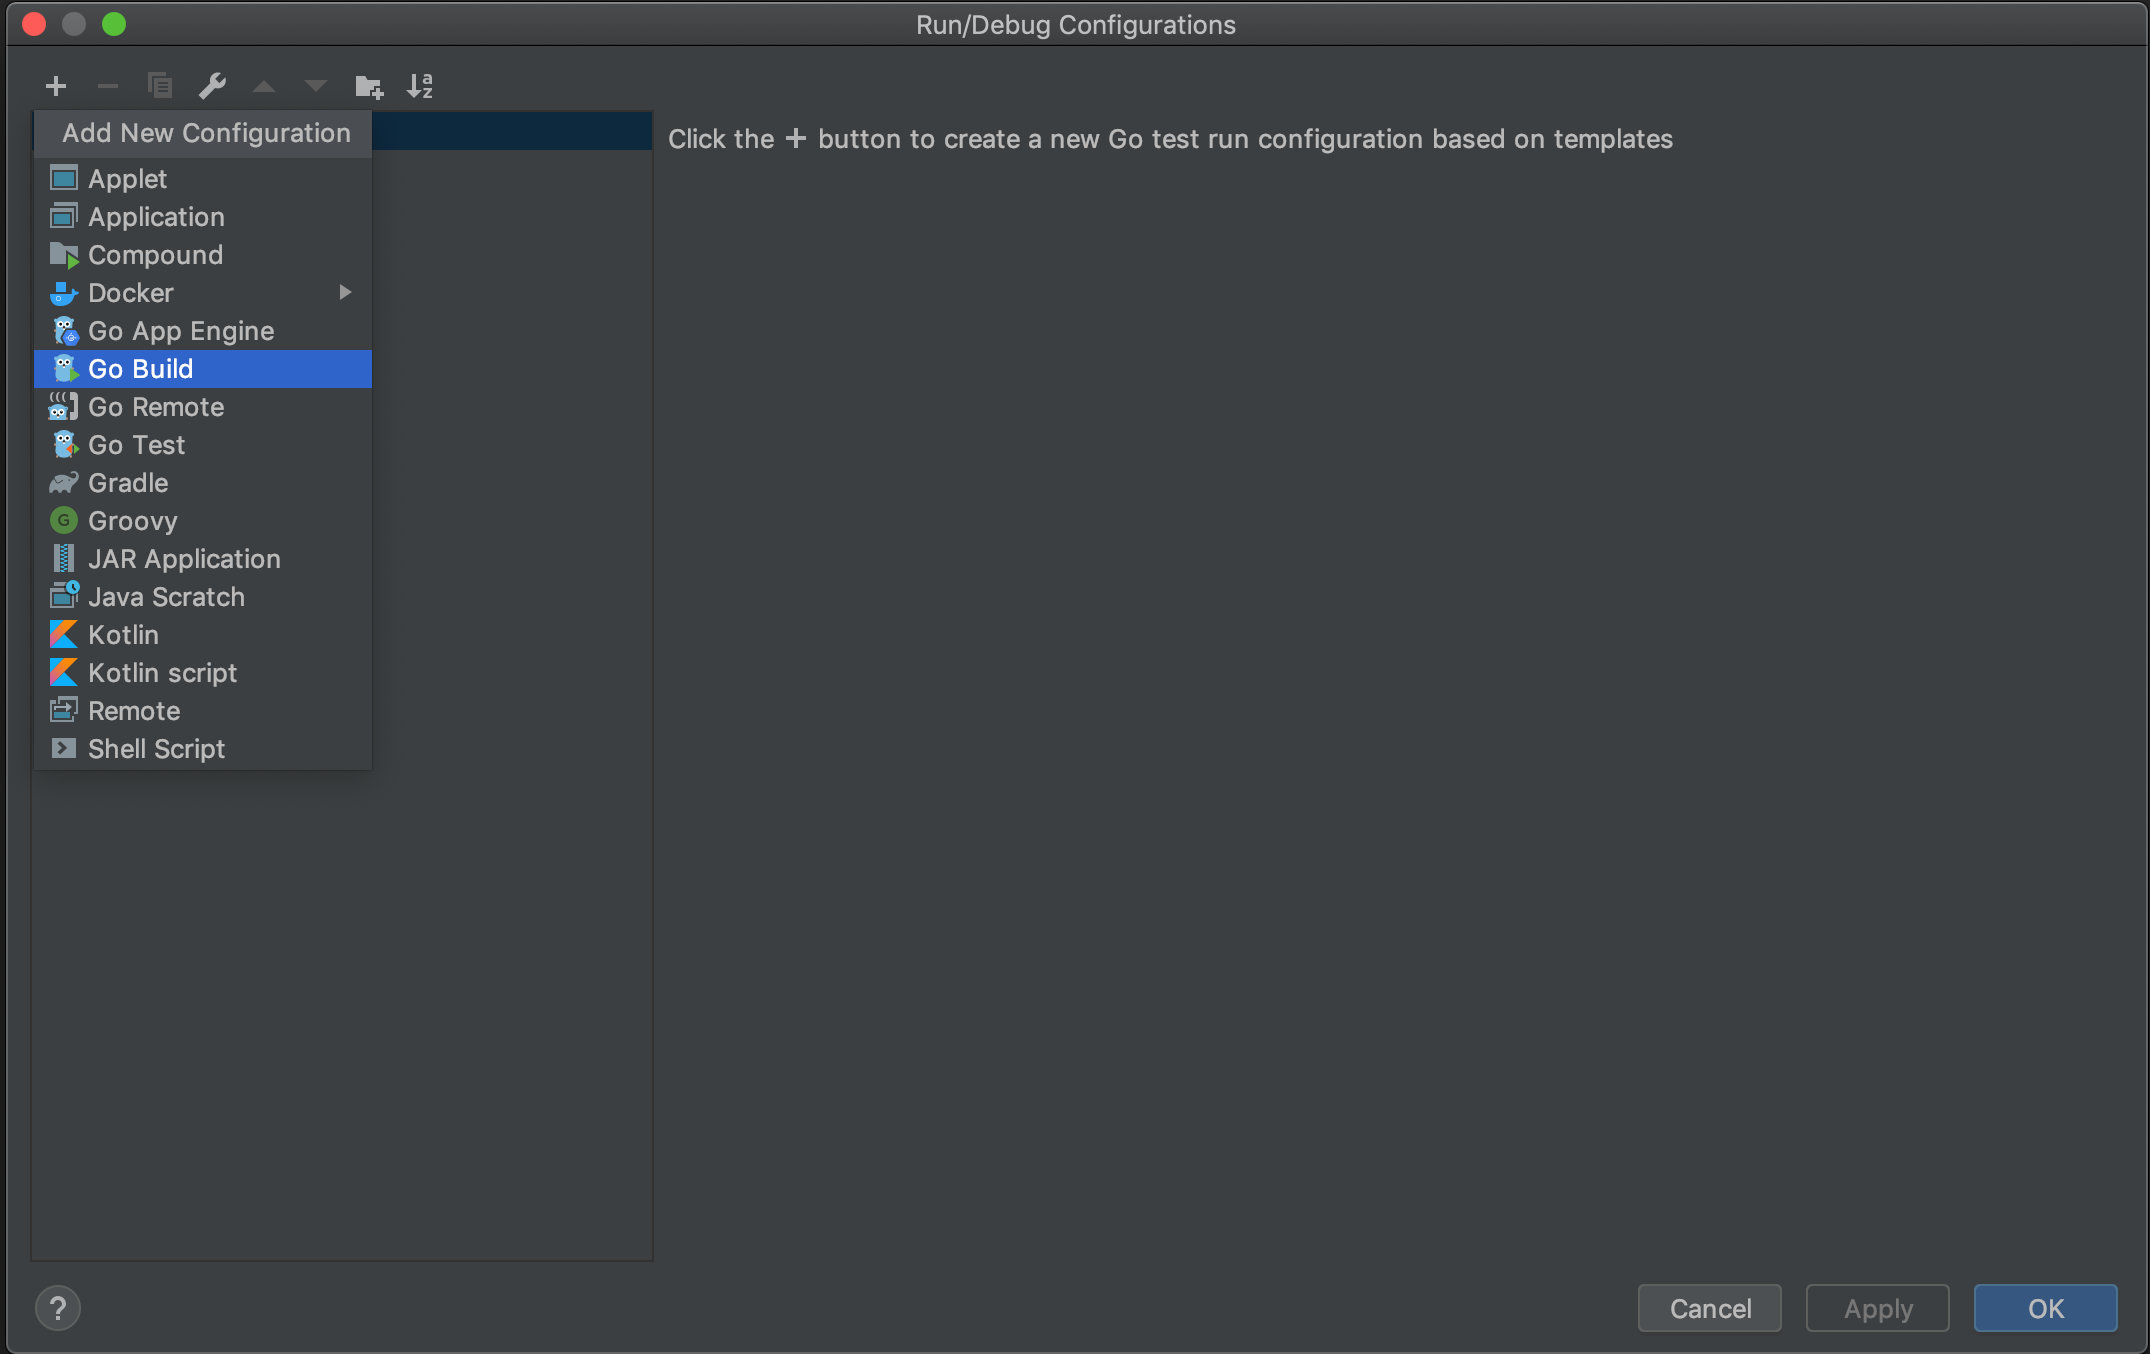
Now add a window will open. In this add a Go Build configuration
Now you can fill in the configuration based on your program.
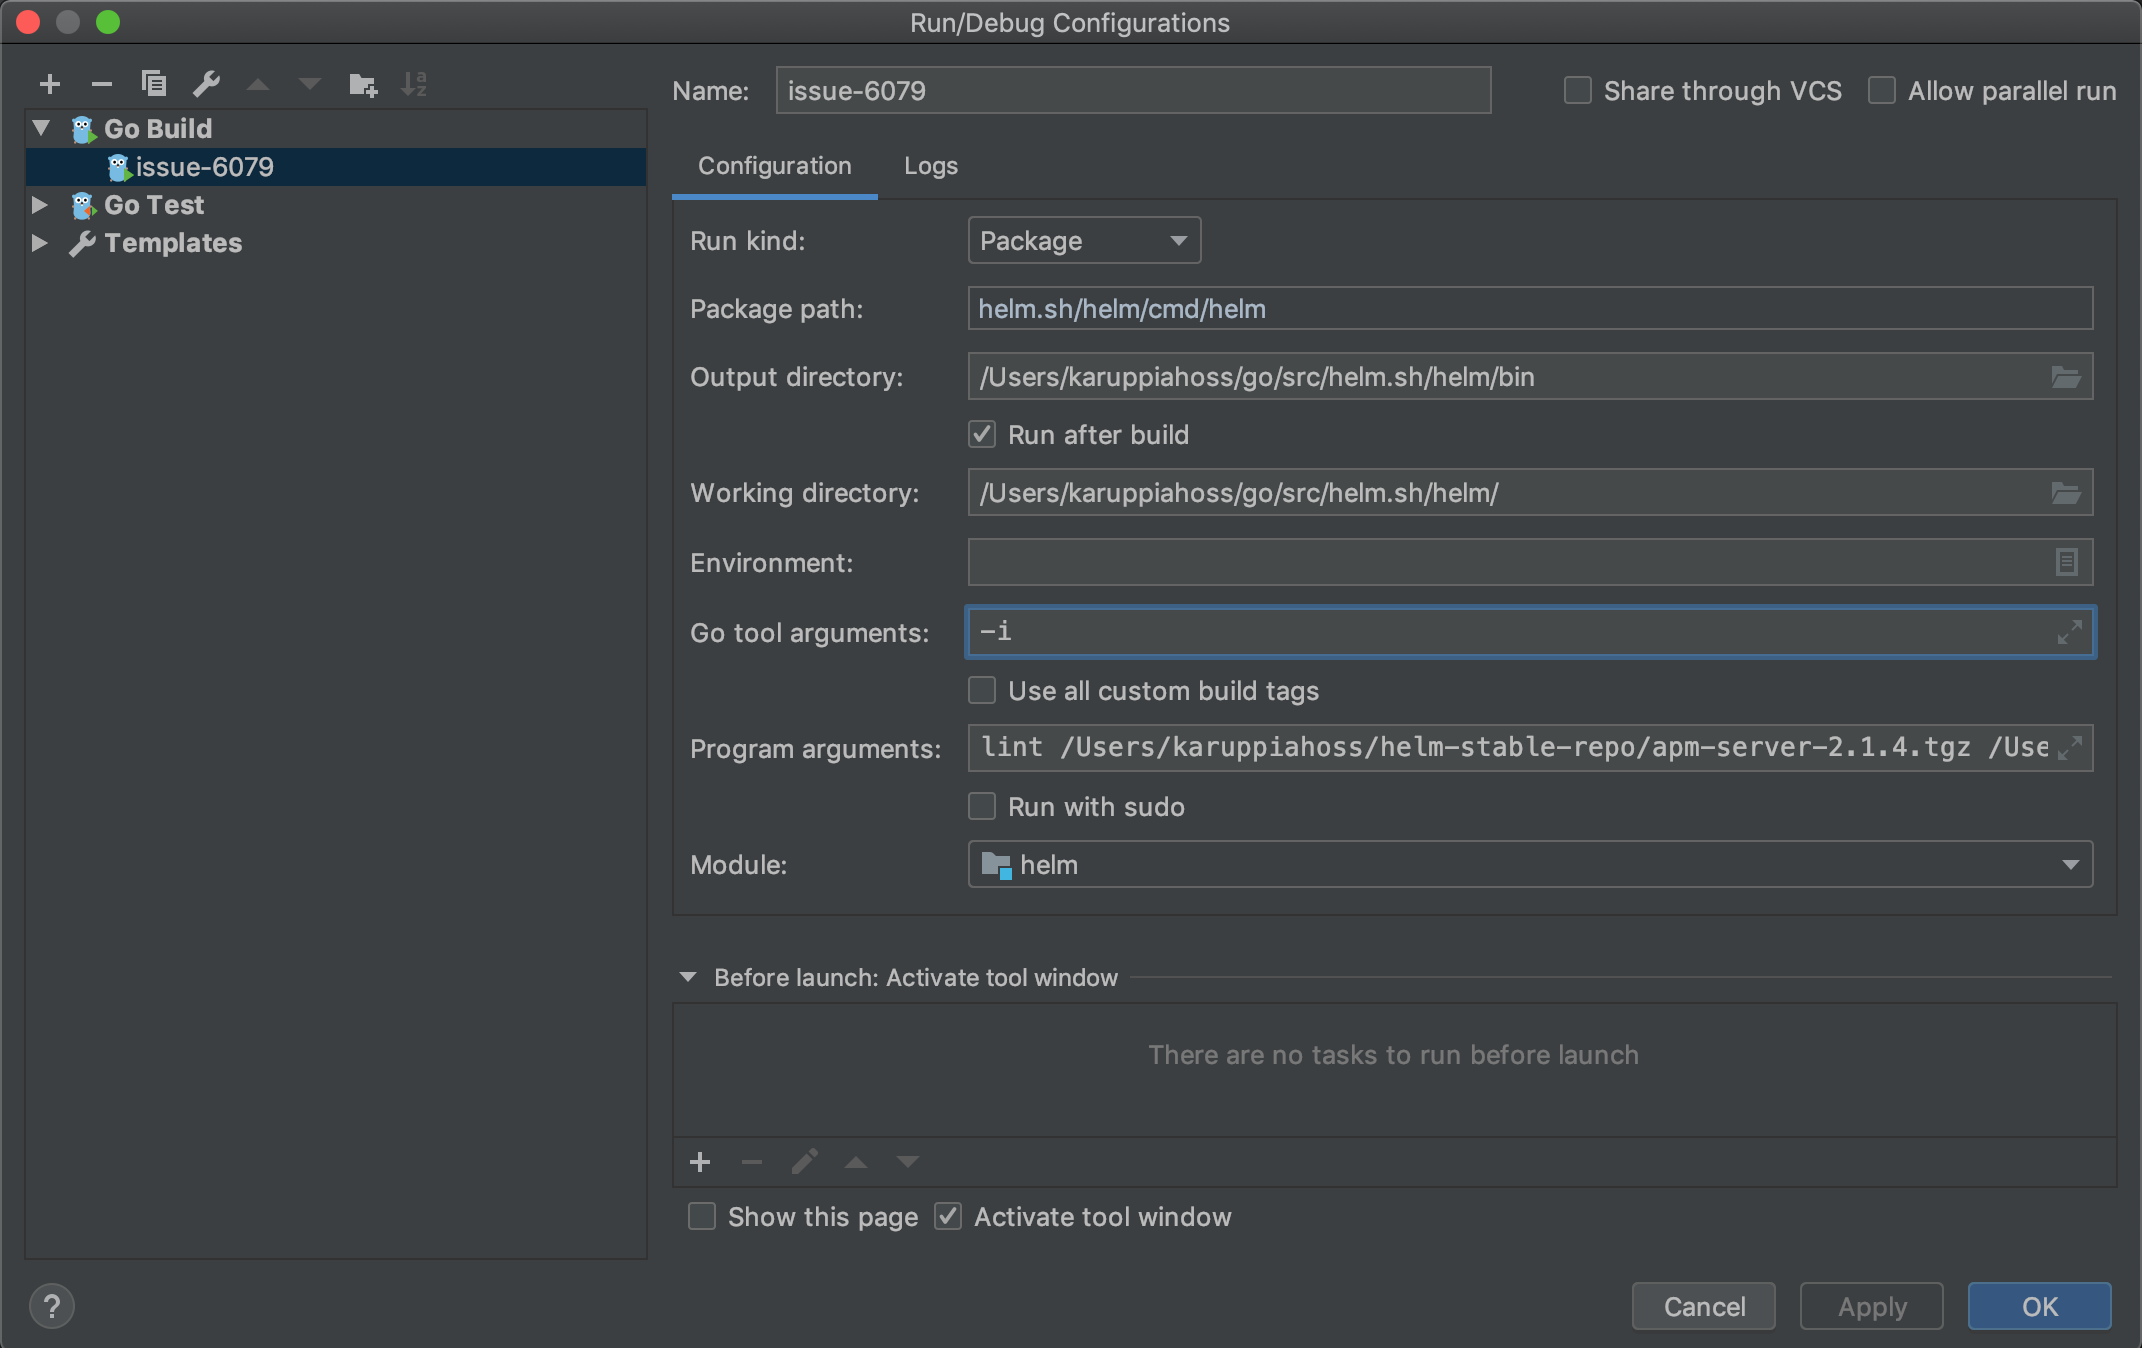
Some field are mandatory, some are optional. For example you need choose the file / package / directory where the program starts (has main function). You can also give build arguments, for example people give ldflags and set variables to set versions etc. And then you can provide the program arguments like in the above example I used it to debug a linting issue hence the lint subcommand, so Intellij will run something like
$ helm lint /Users/karuppiahoss/helm-stable-repo/apm-server-2.1.4.tgz /Users/karuppiahoss/helm-stable-repo/atlantis-3.7.0.tgz
Now, once the configuration is done, you need to apply it and say ok, and then choose the configuration that you just created in the top right configurations list

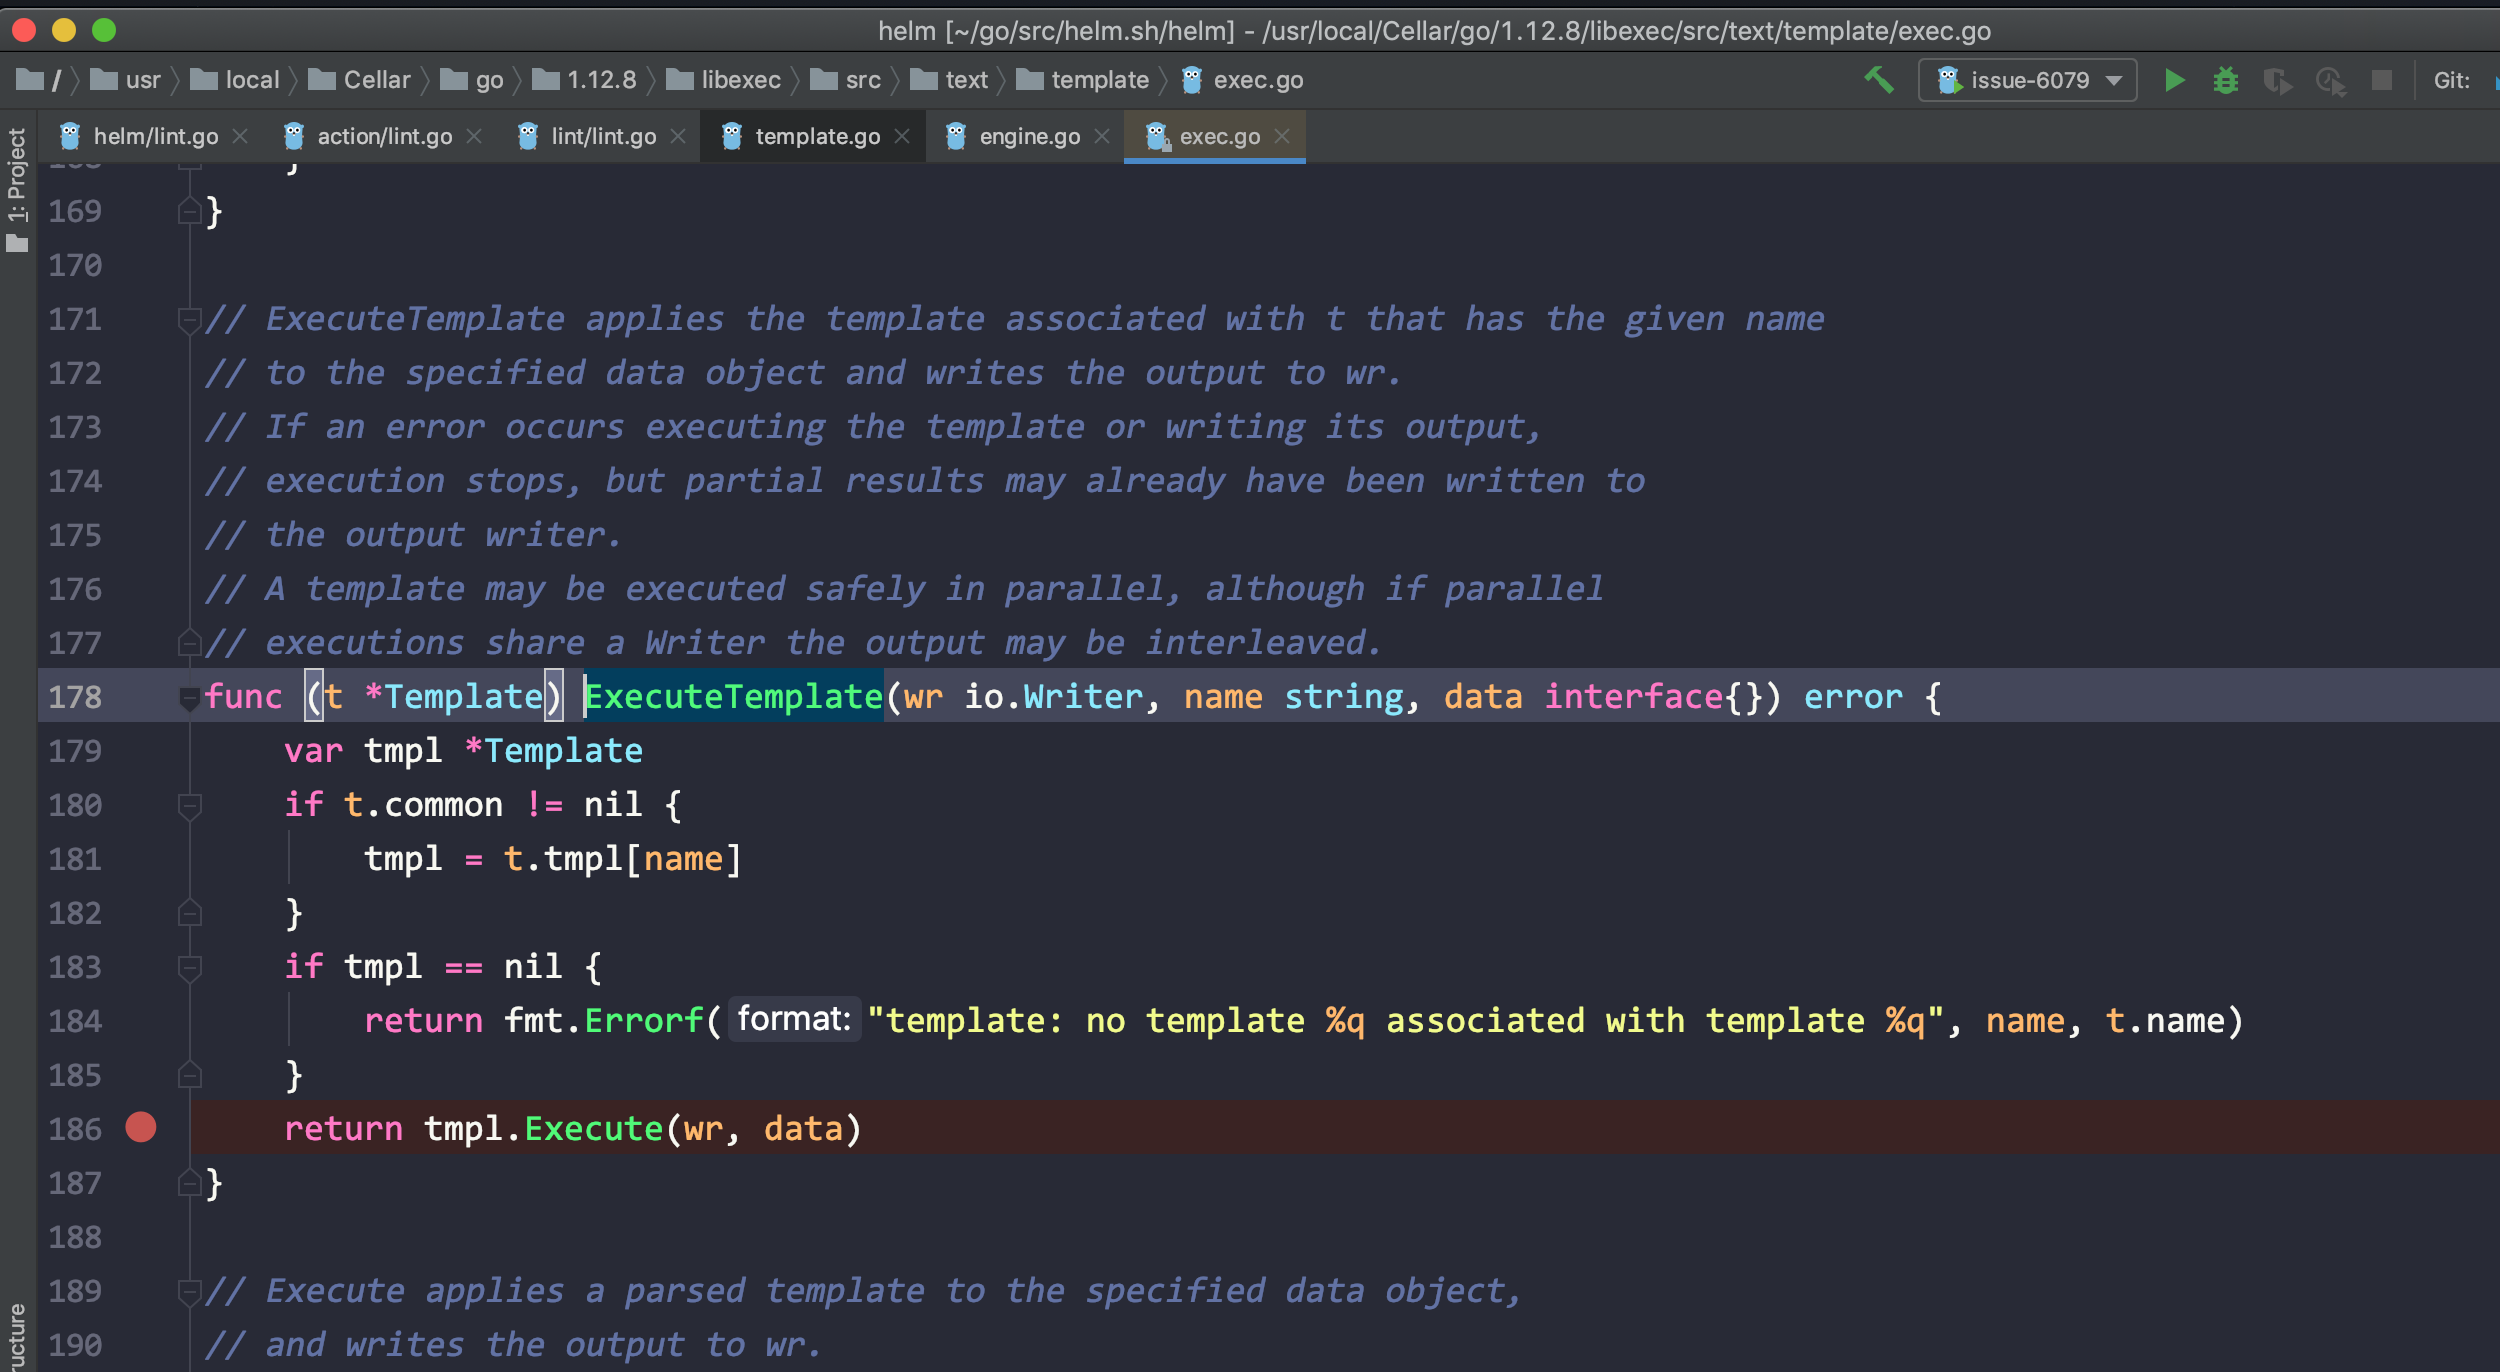
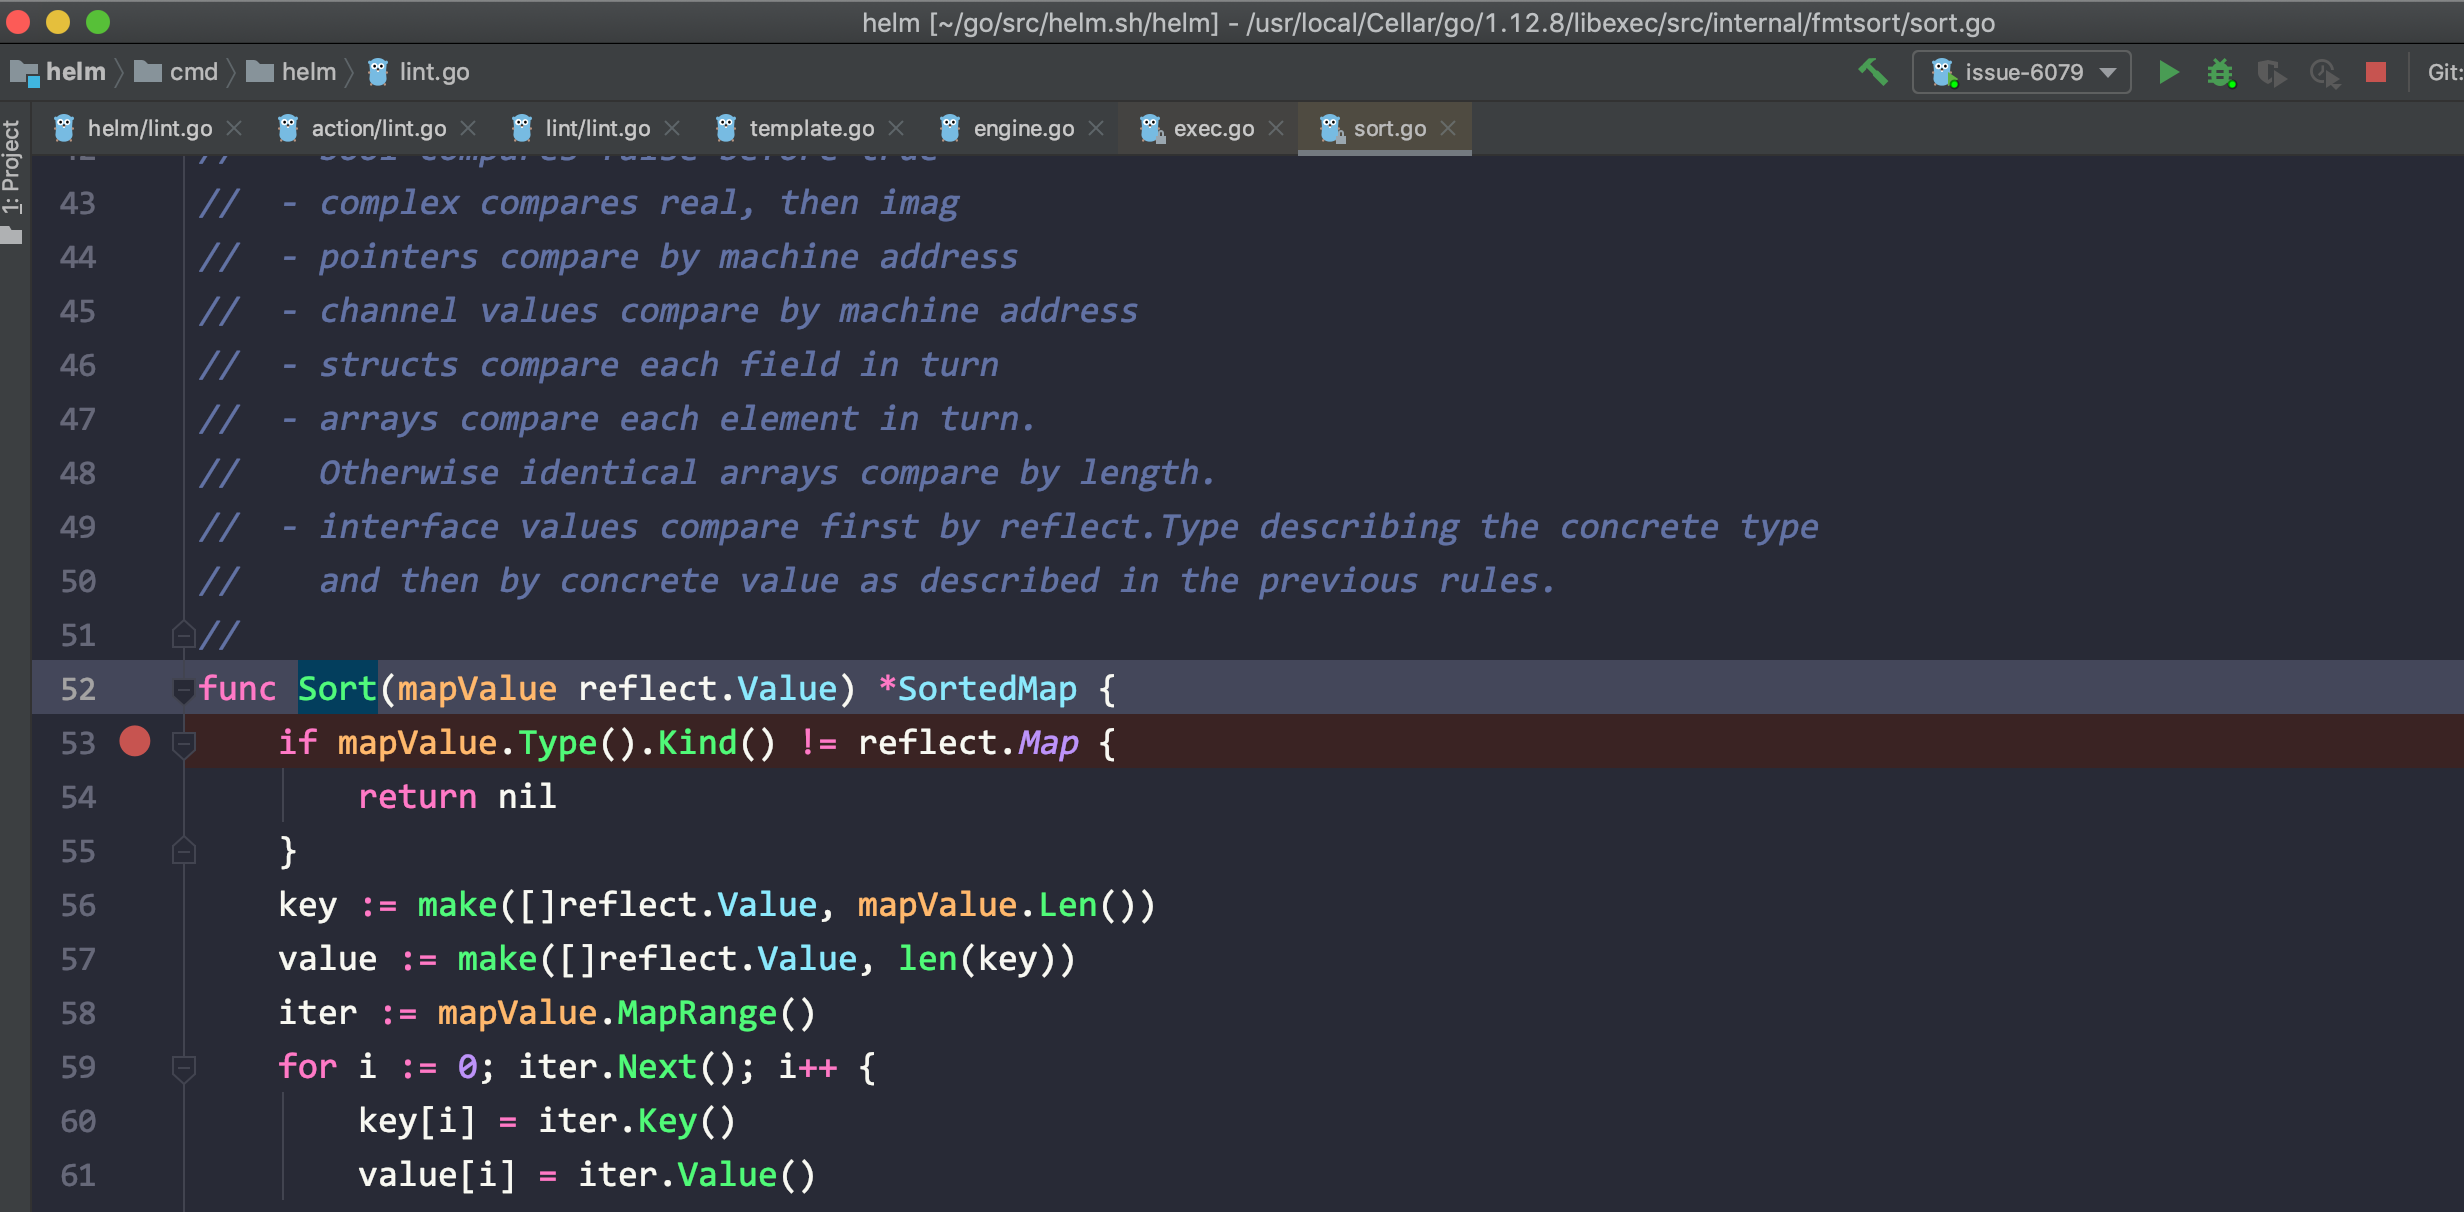
Now you can run it with the play icon button or debug it with the bug icon button. Before debugging you need to add breakpoints to your program code - wherever you want to stop the program and see the data present in the variables and you can evaluate expressions too! And while debugging you can add breakpoints on the go and you can add breakpoints anywhere in the program execution! Like even in the standard library code execution! See below for examples of putting breakpoints and how I have put breakpoints in the template golang stdblib and also an example of how the debug window looks like
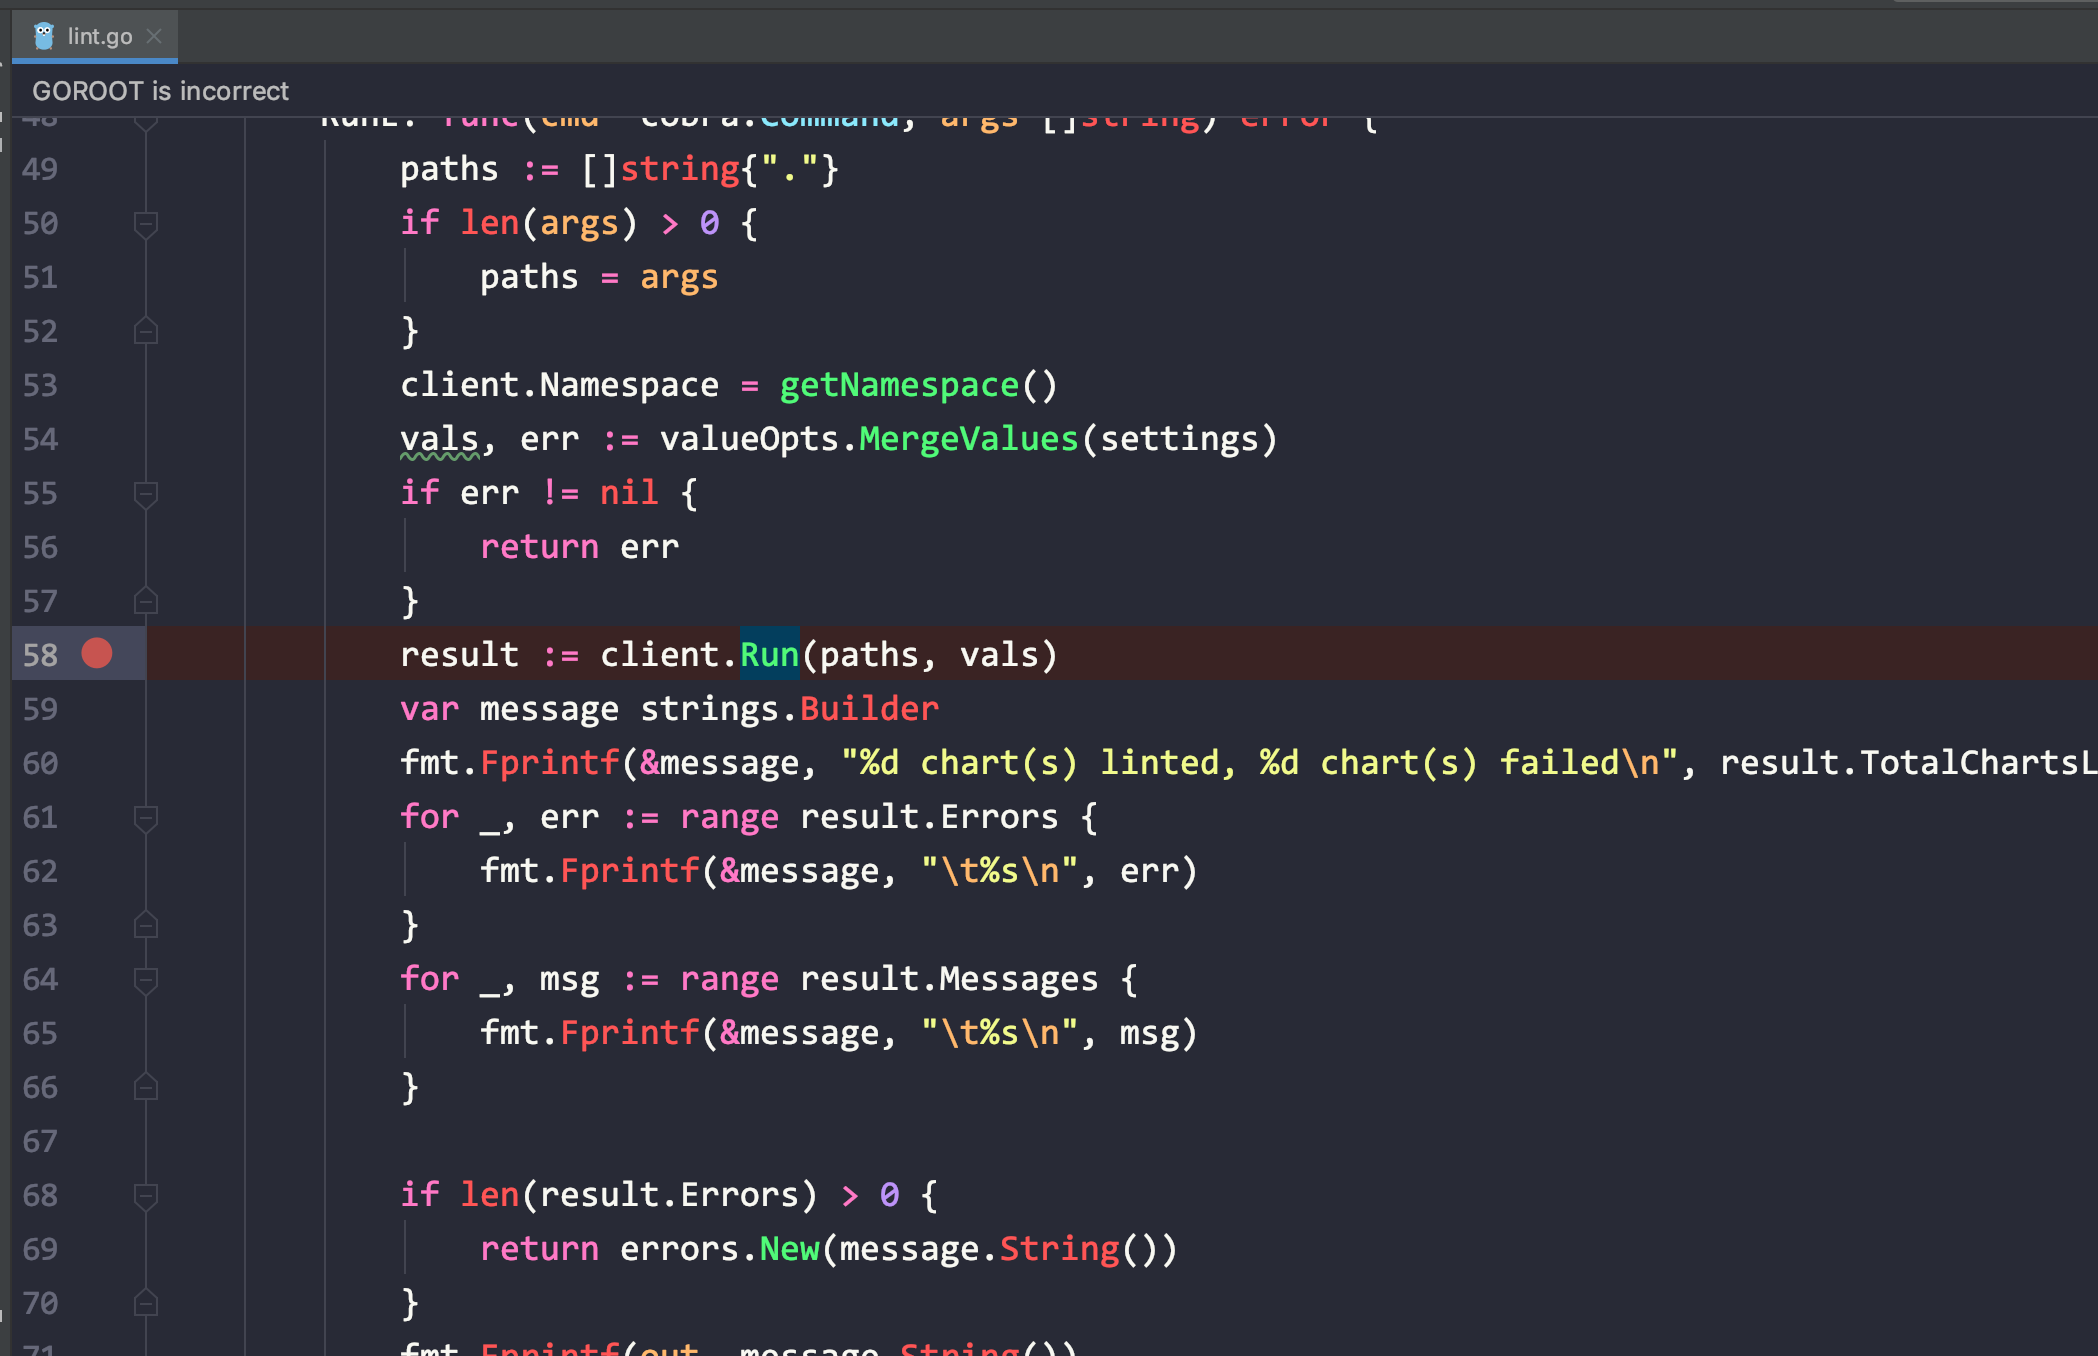
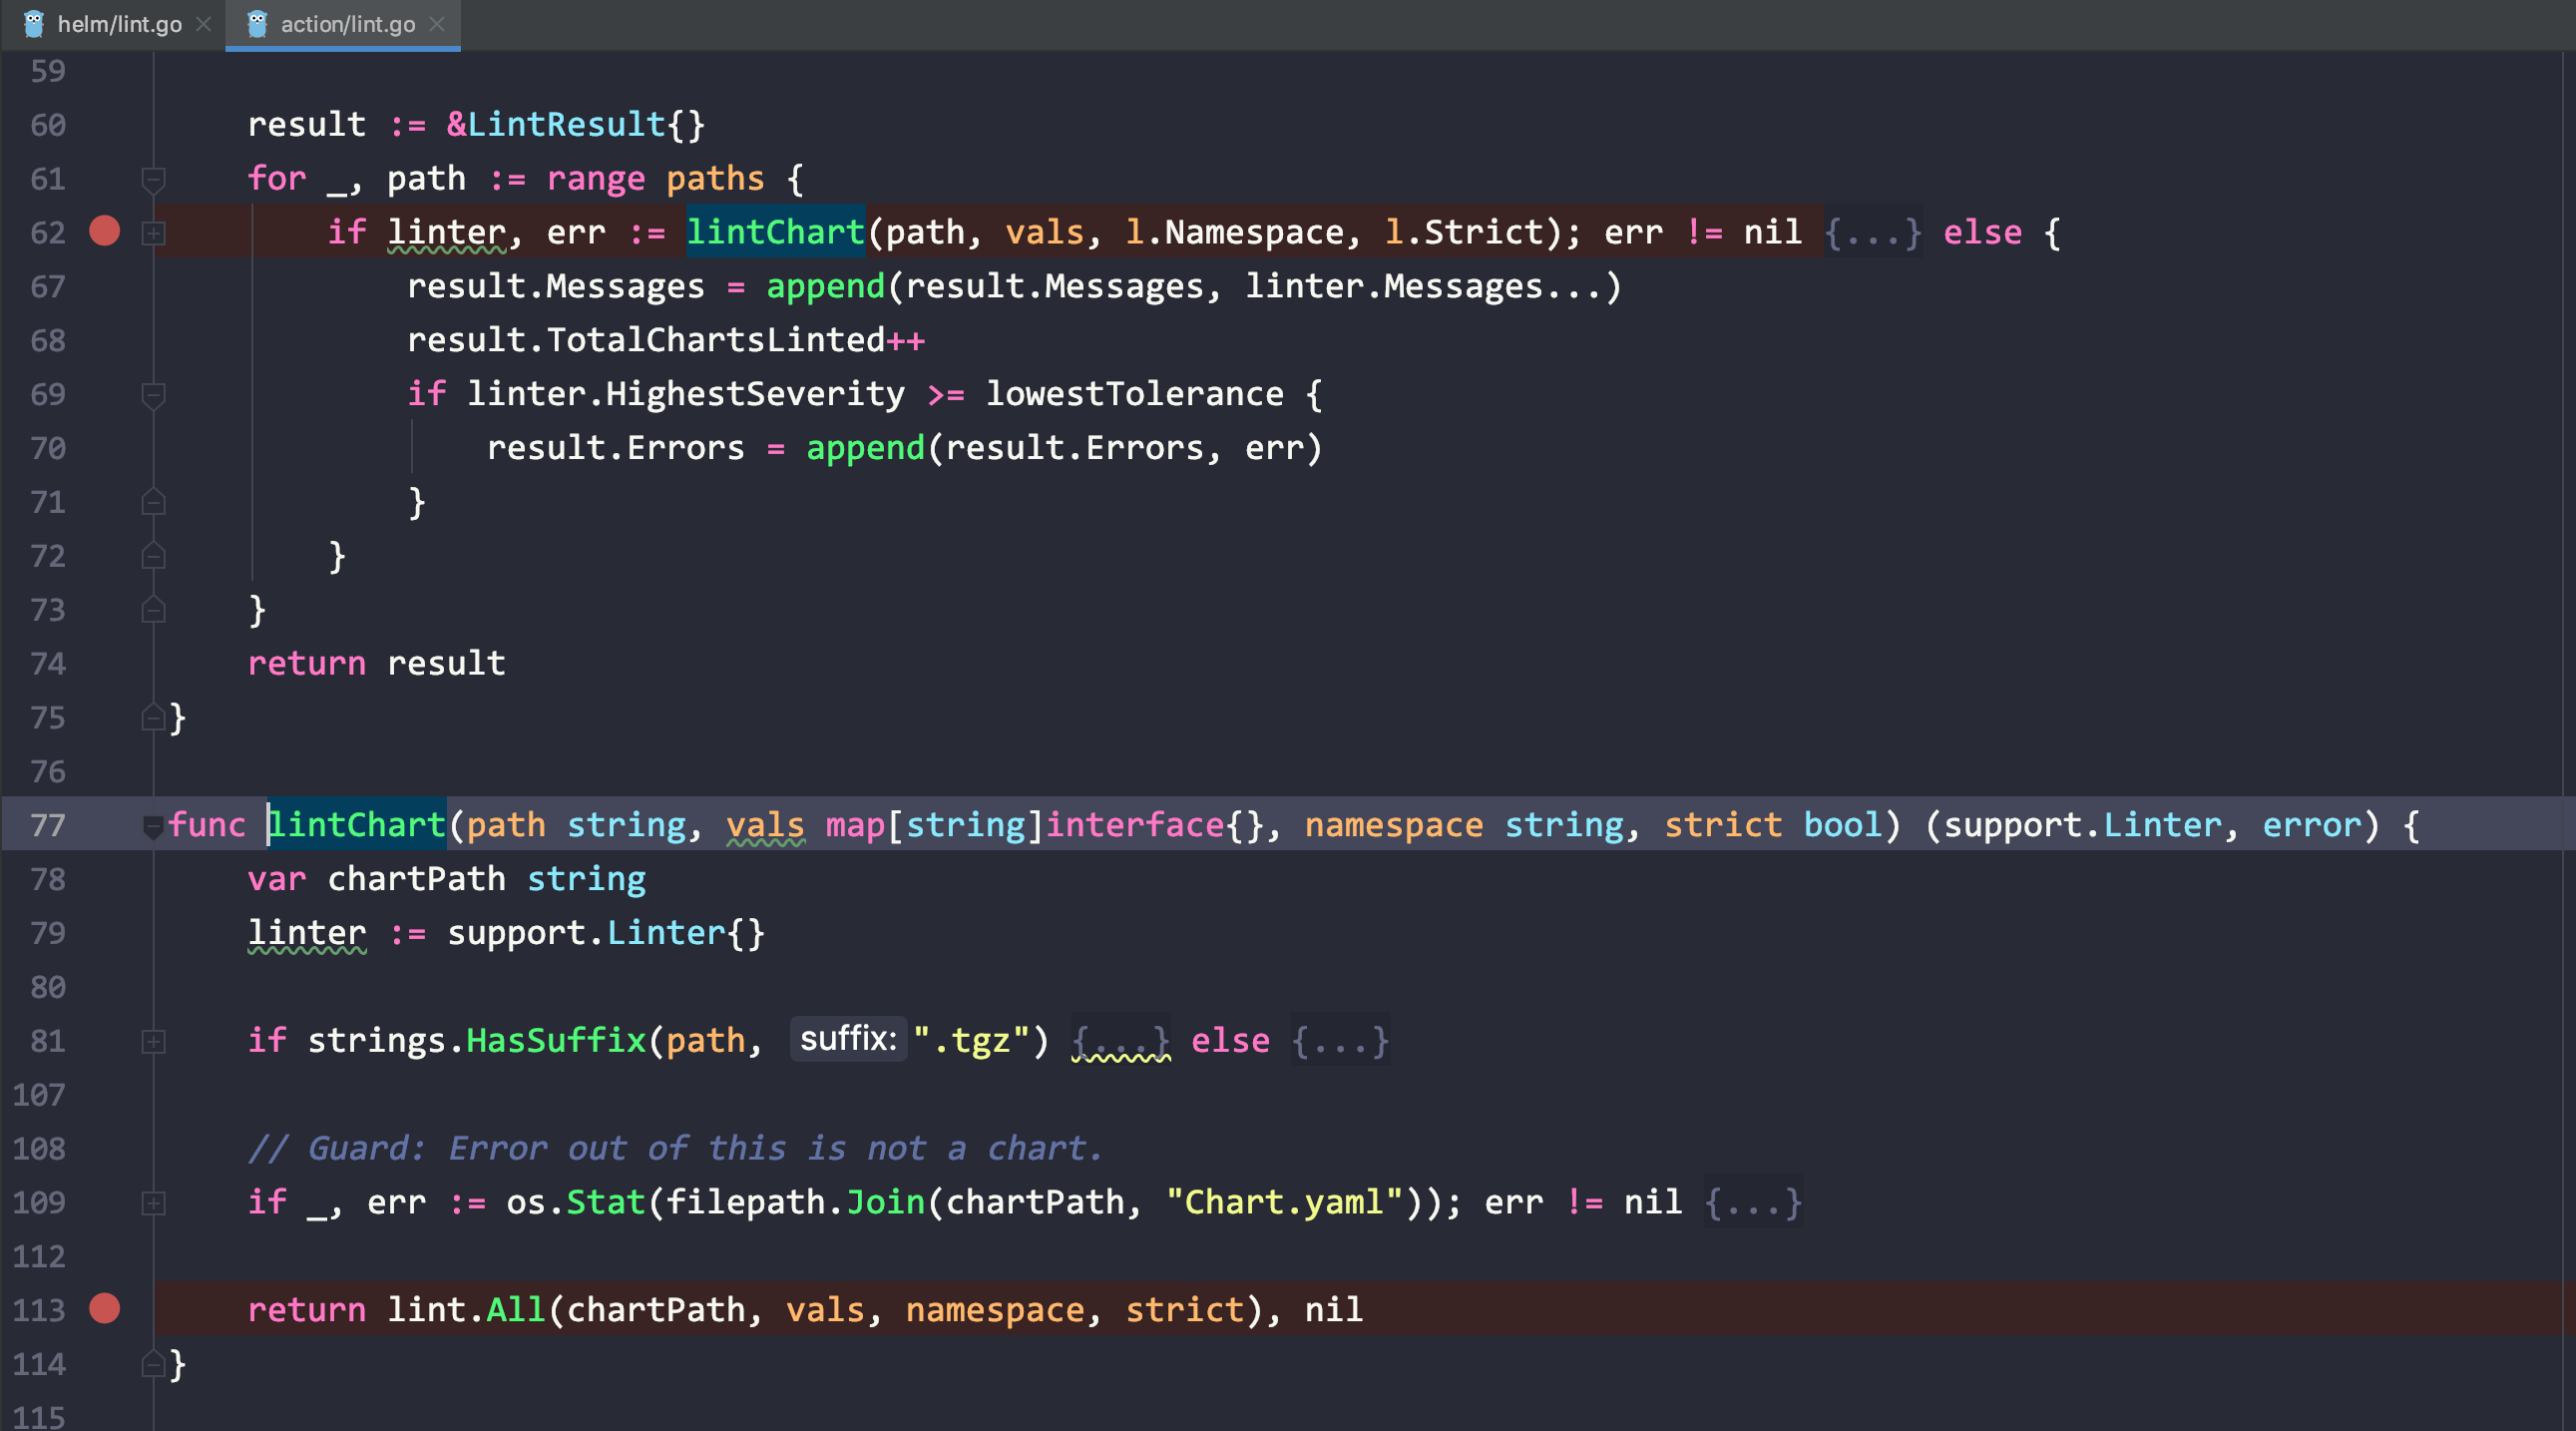
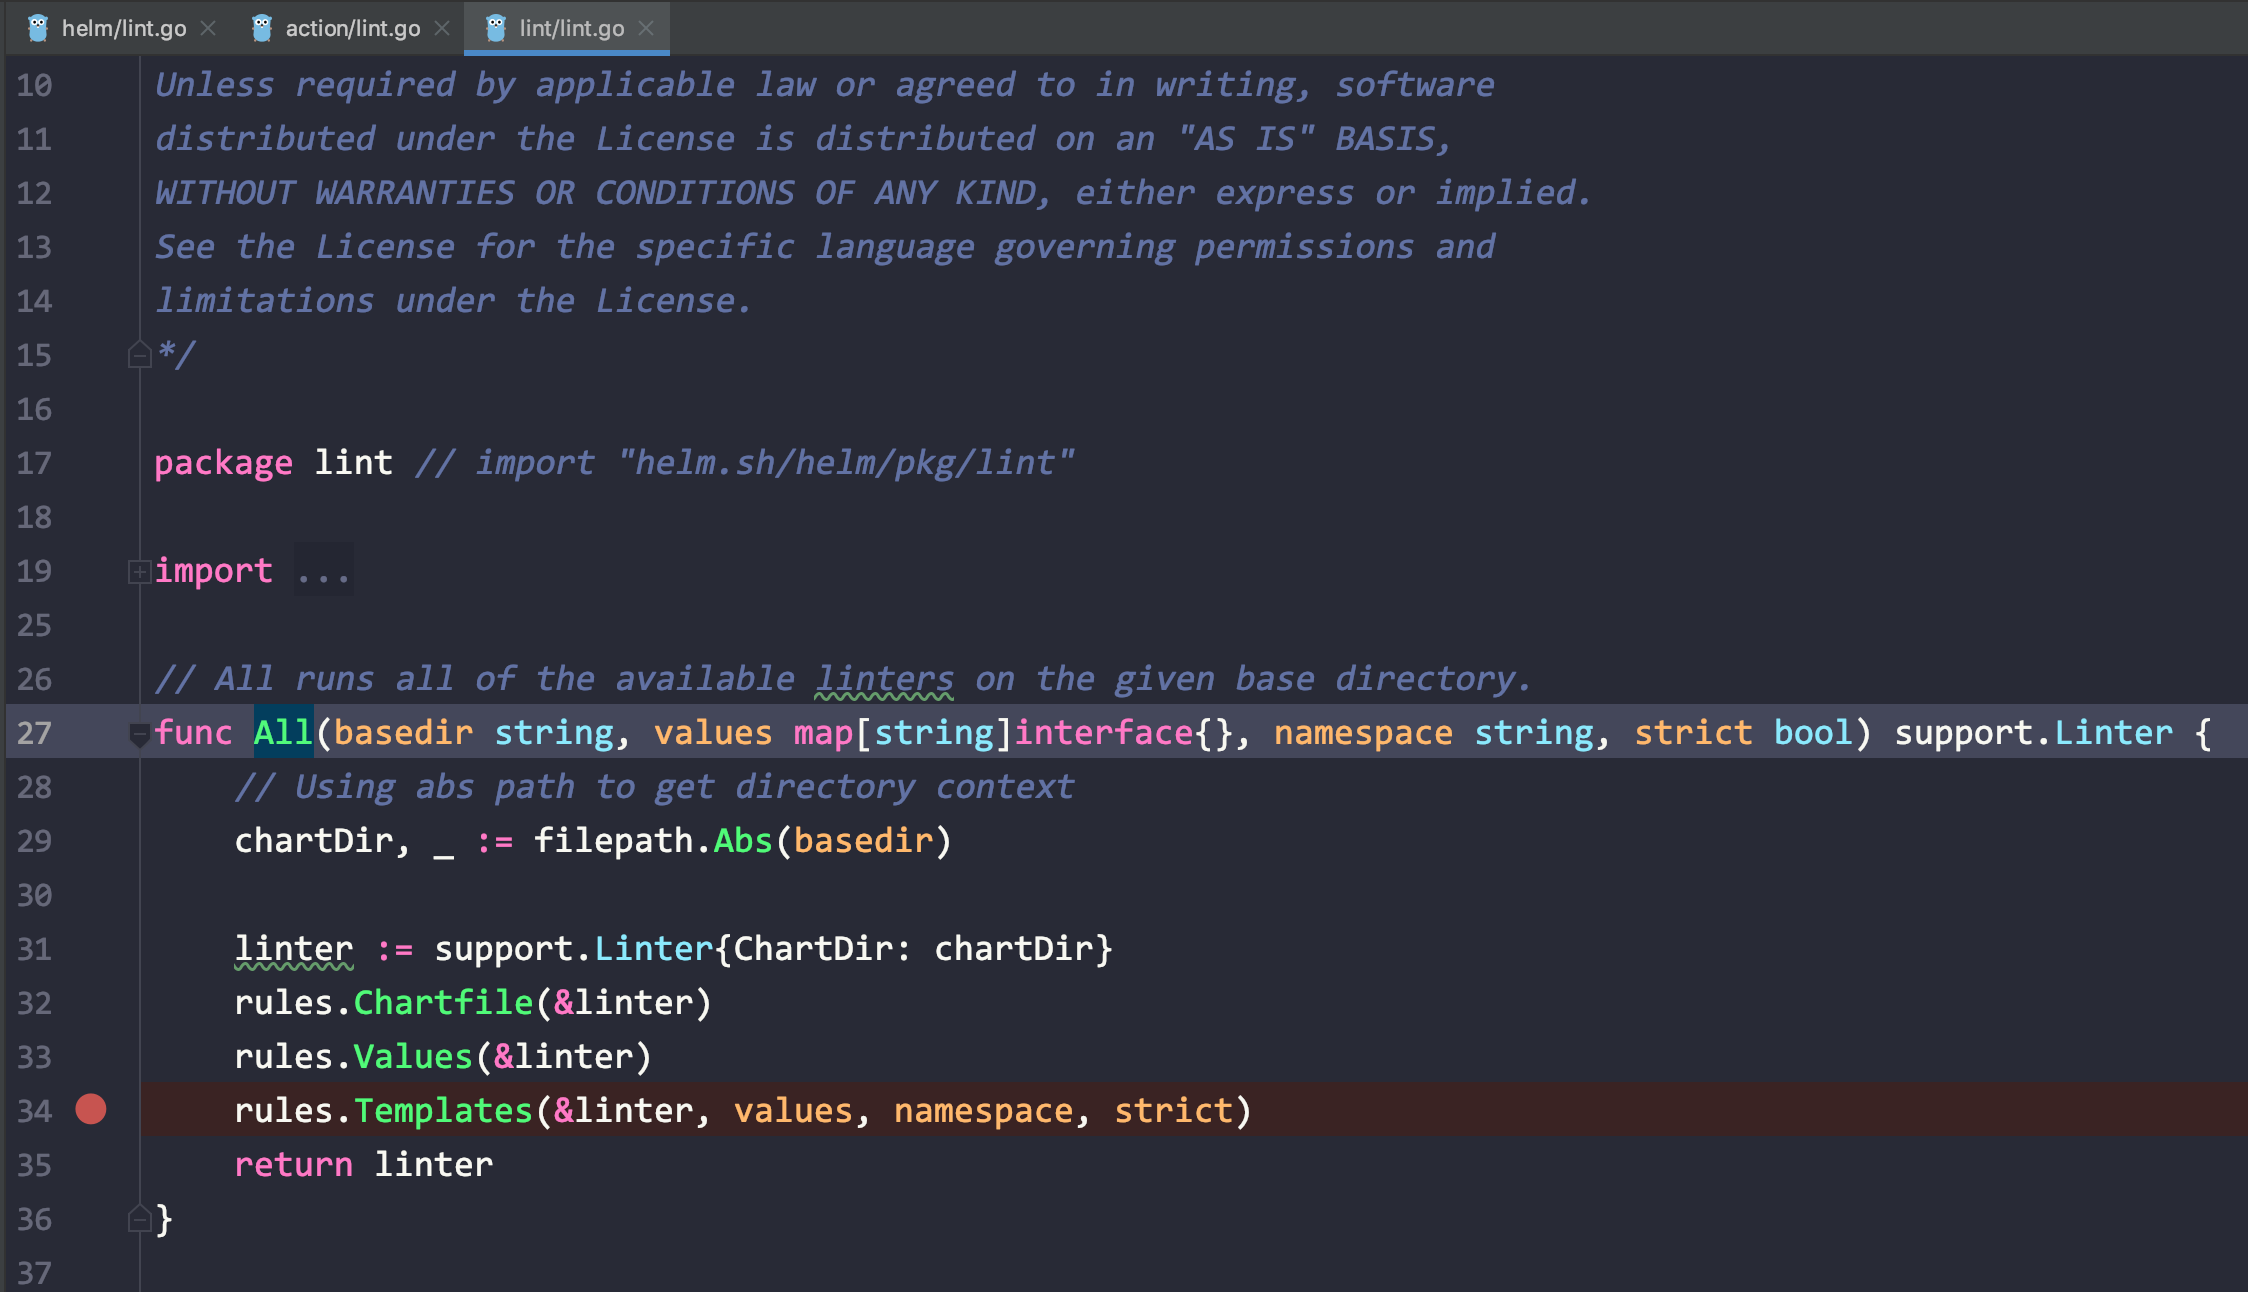
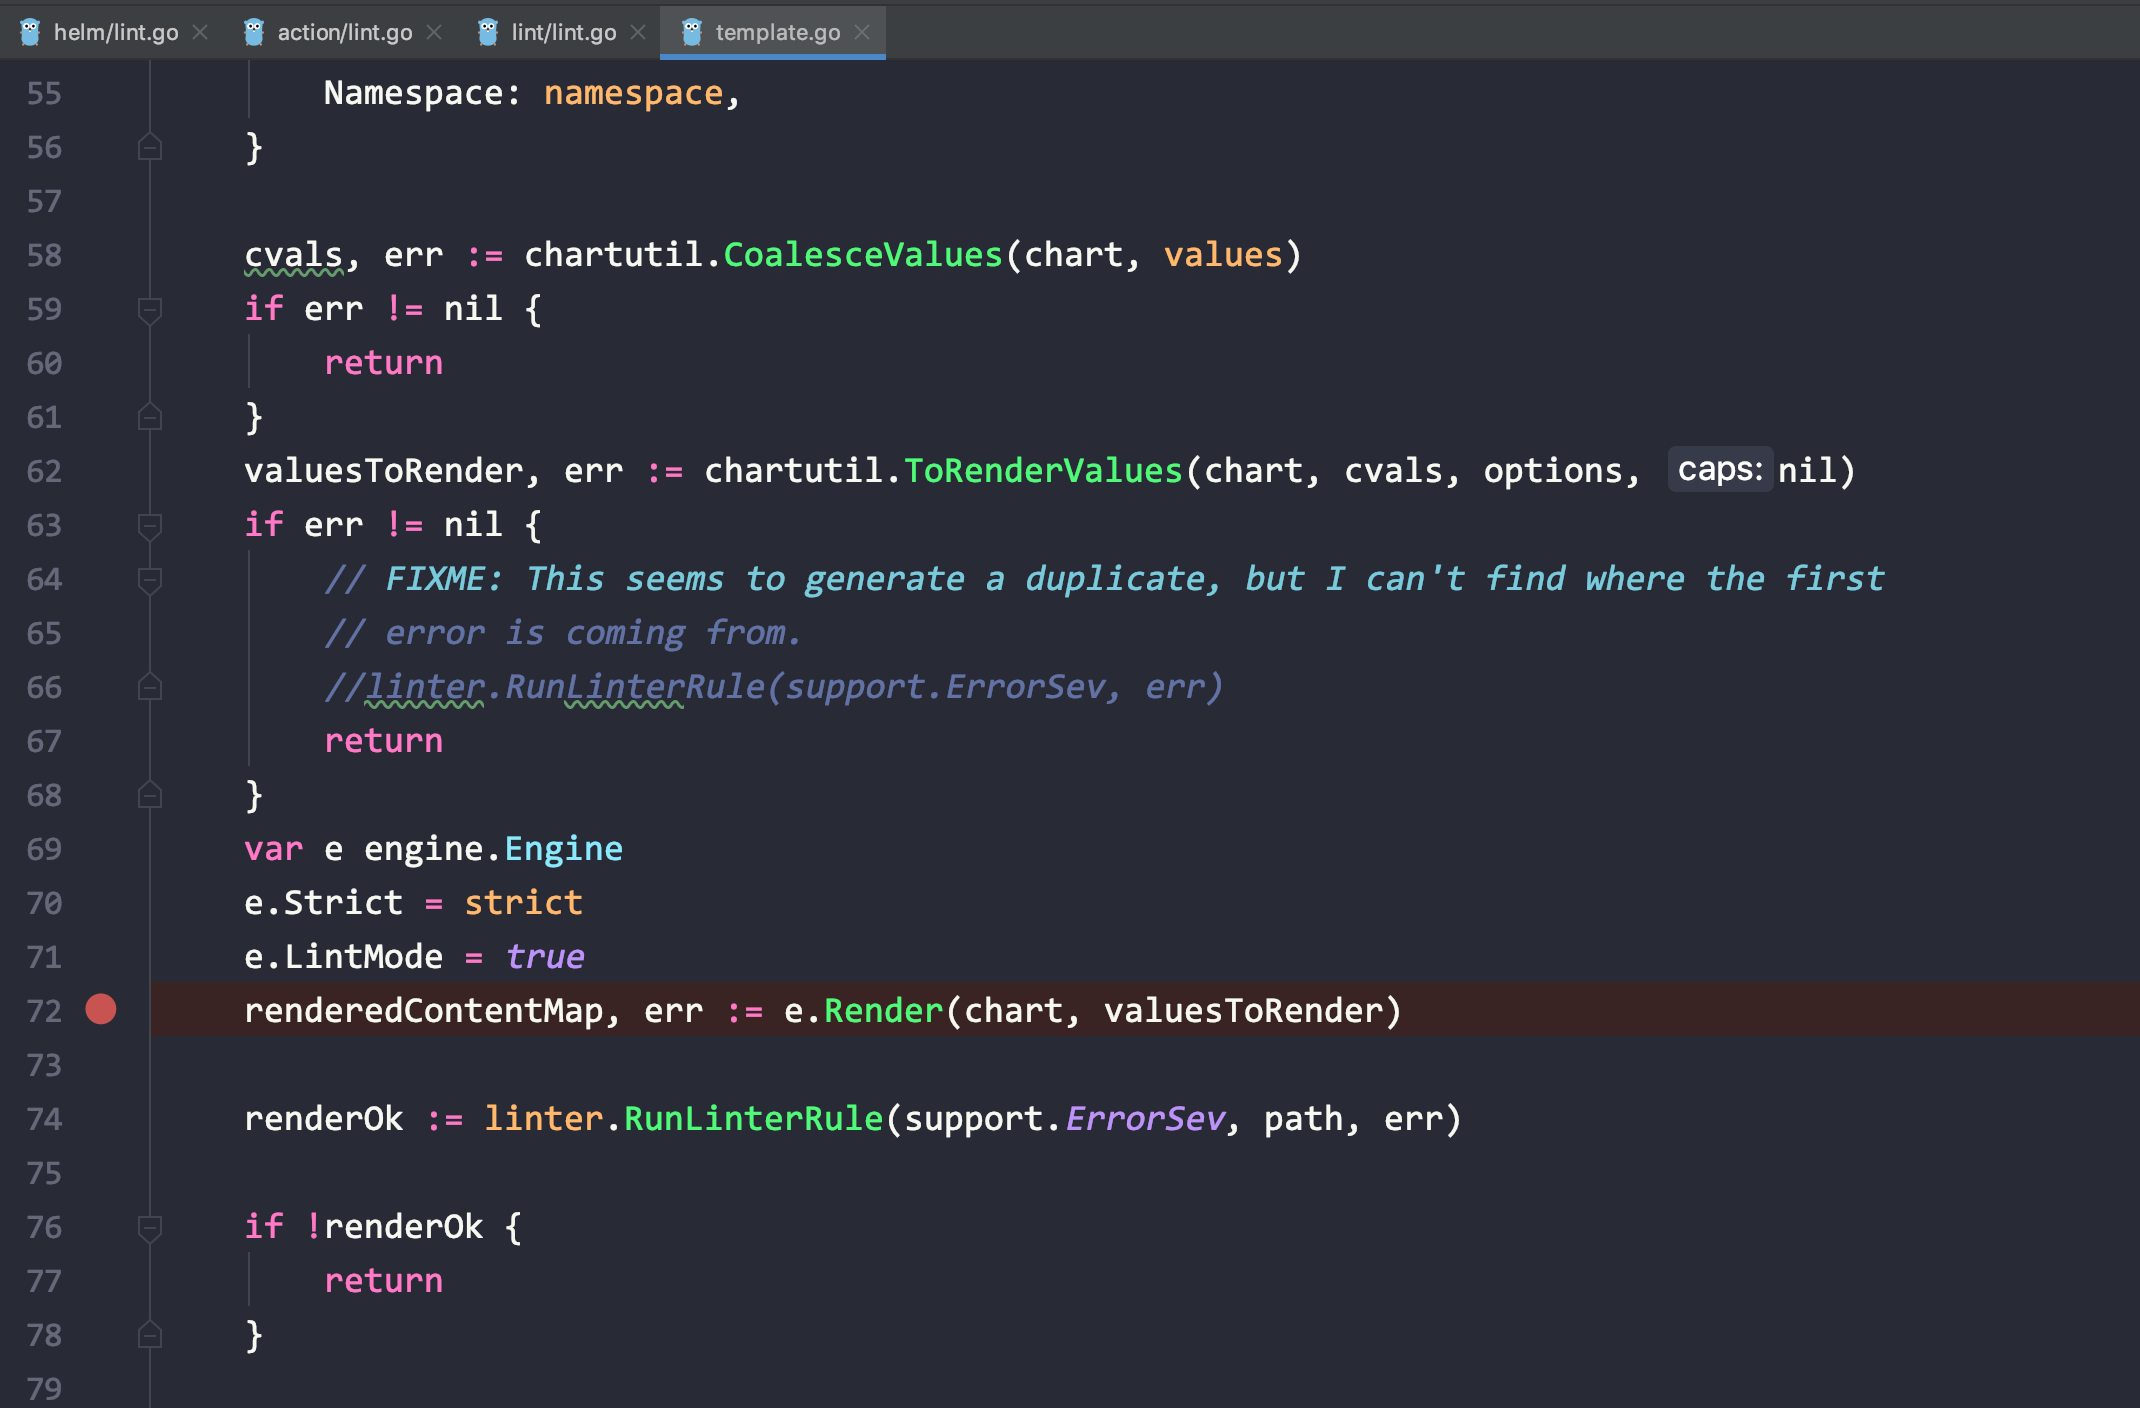
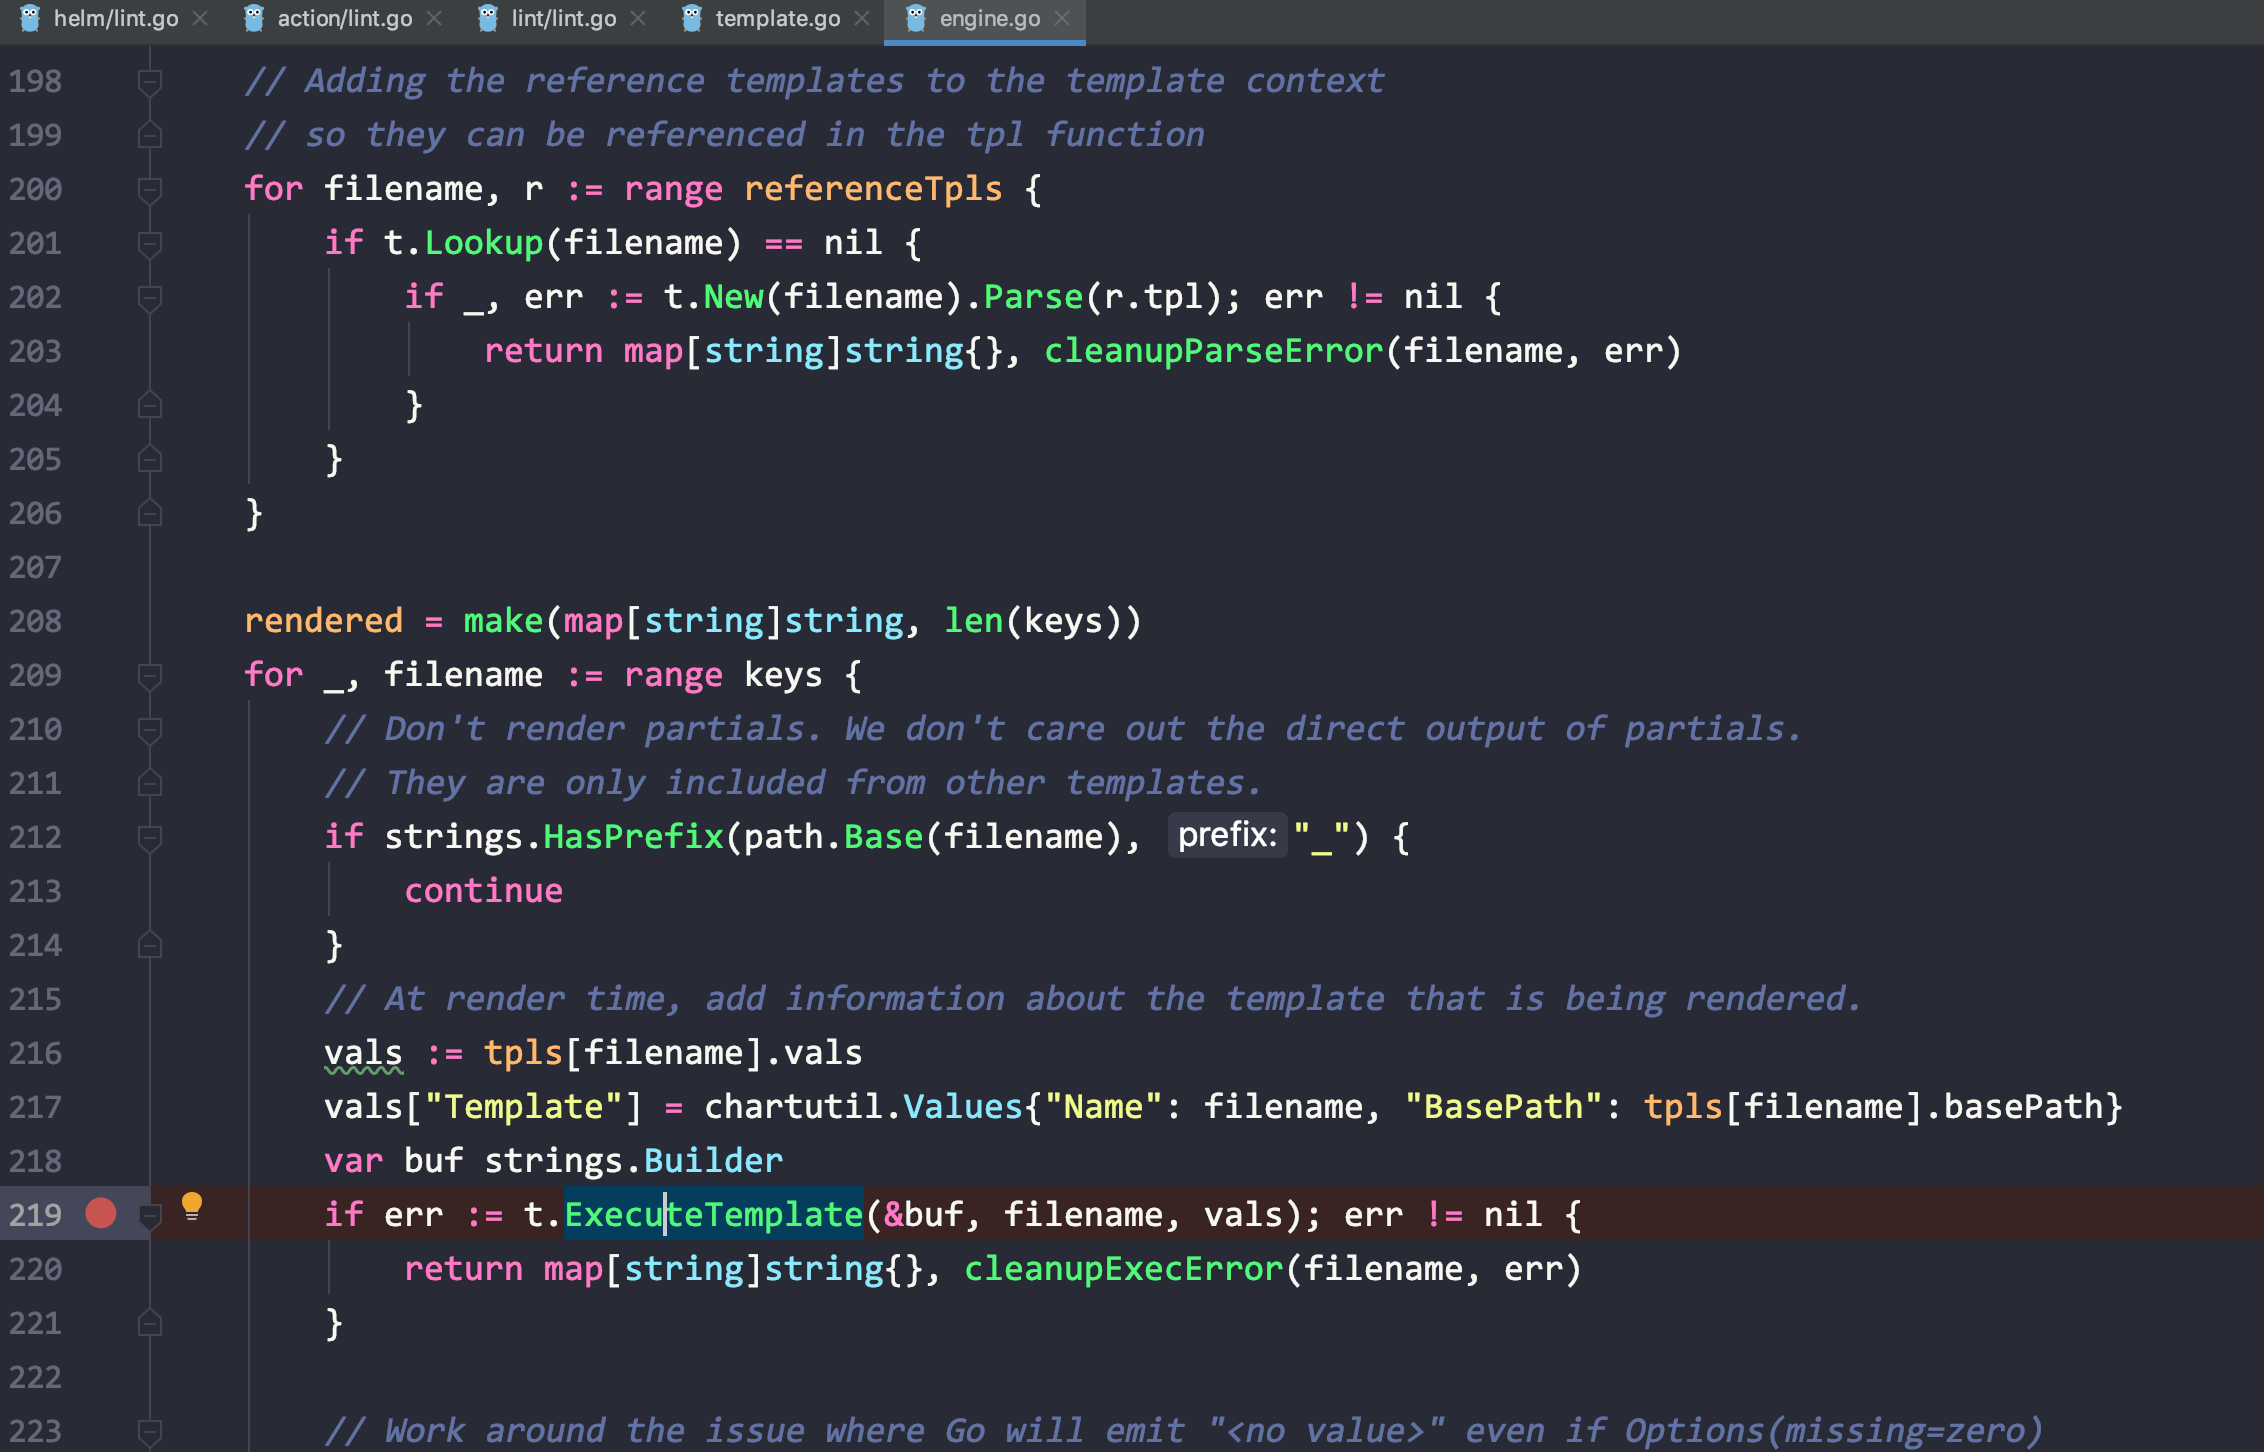
If you notice the image below (the intellij title bar path), I have a breakpoint in the golang standard library packages text/template and internal/fmtsort
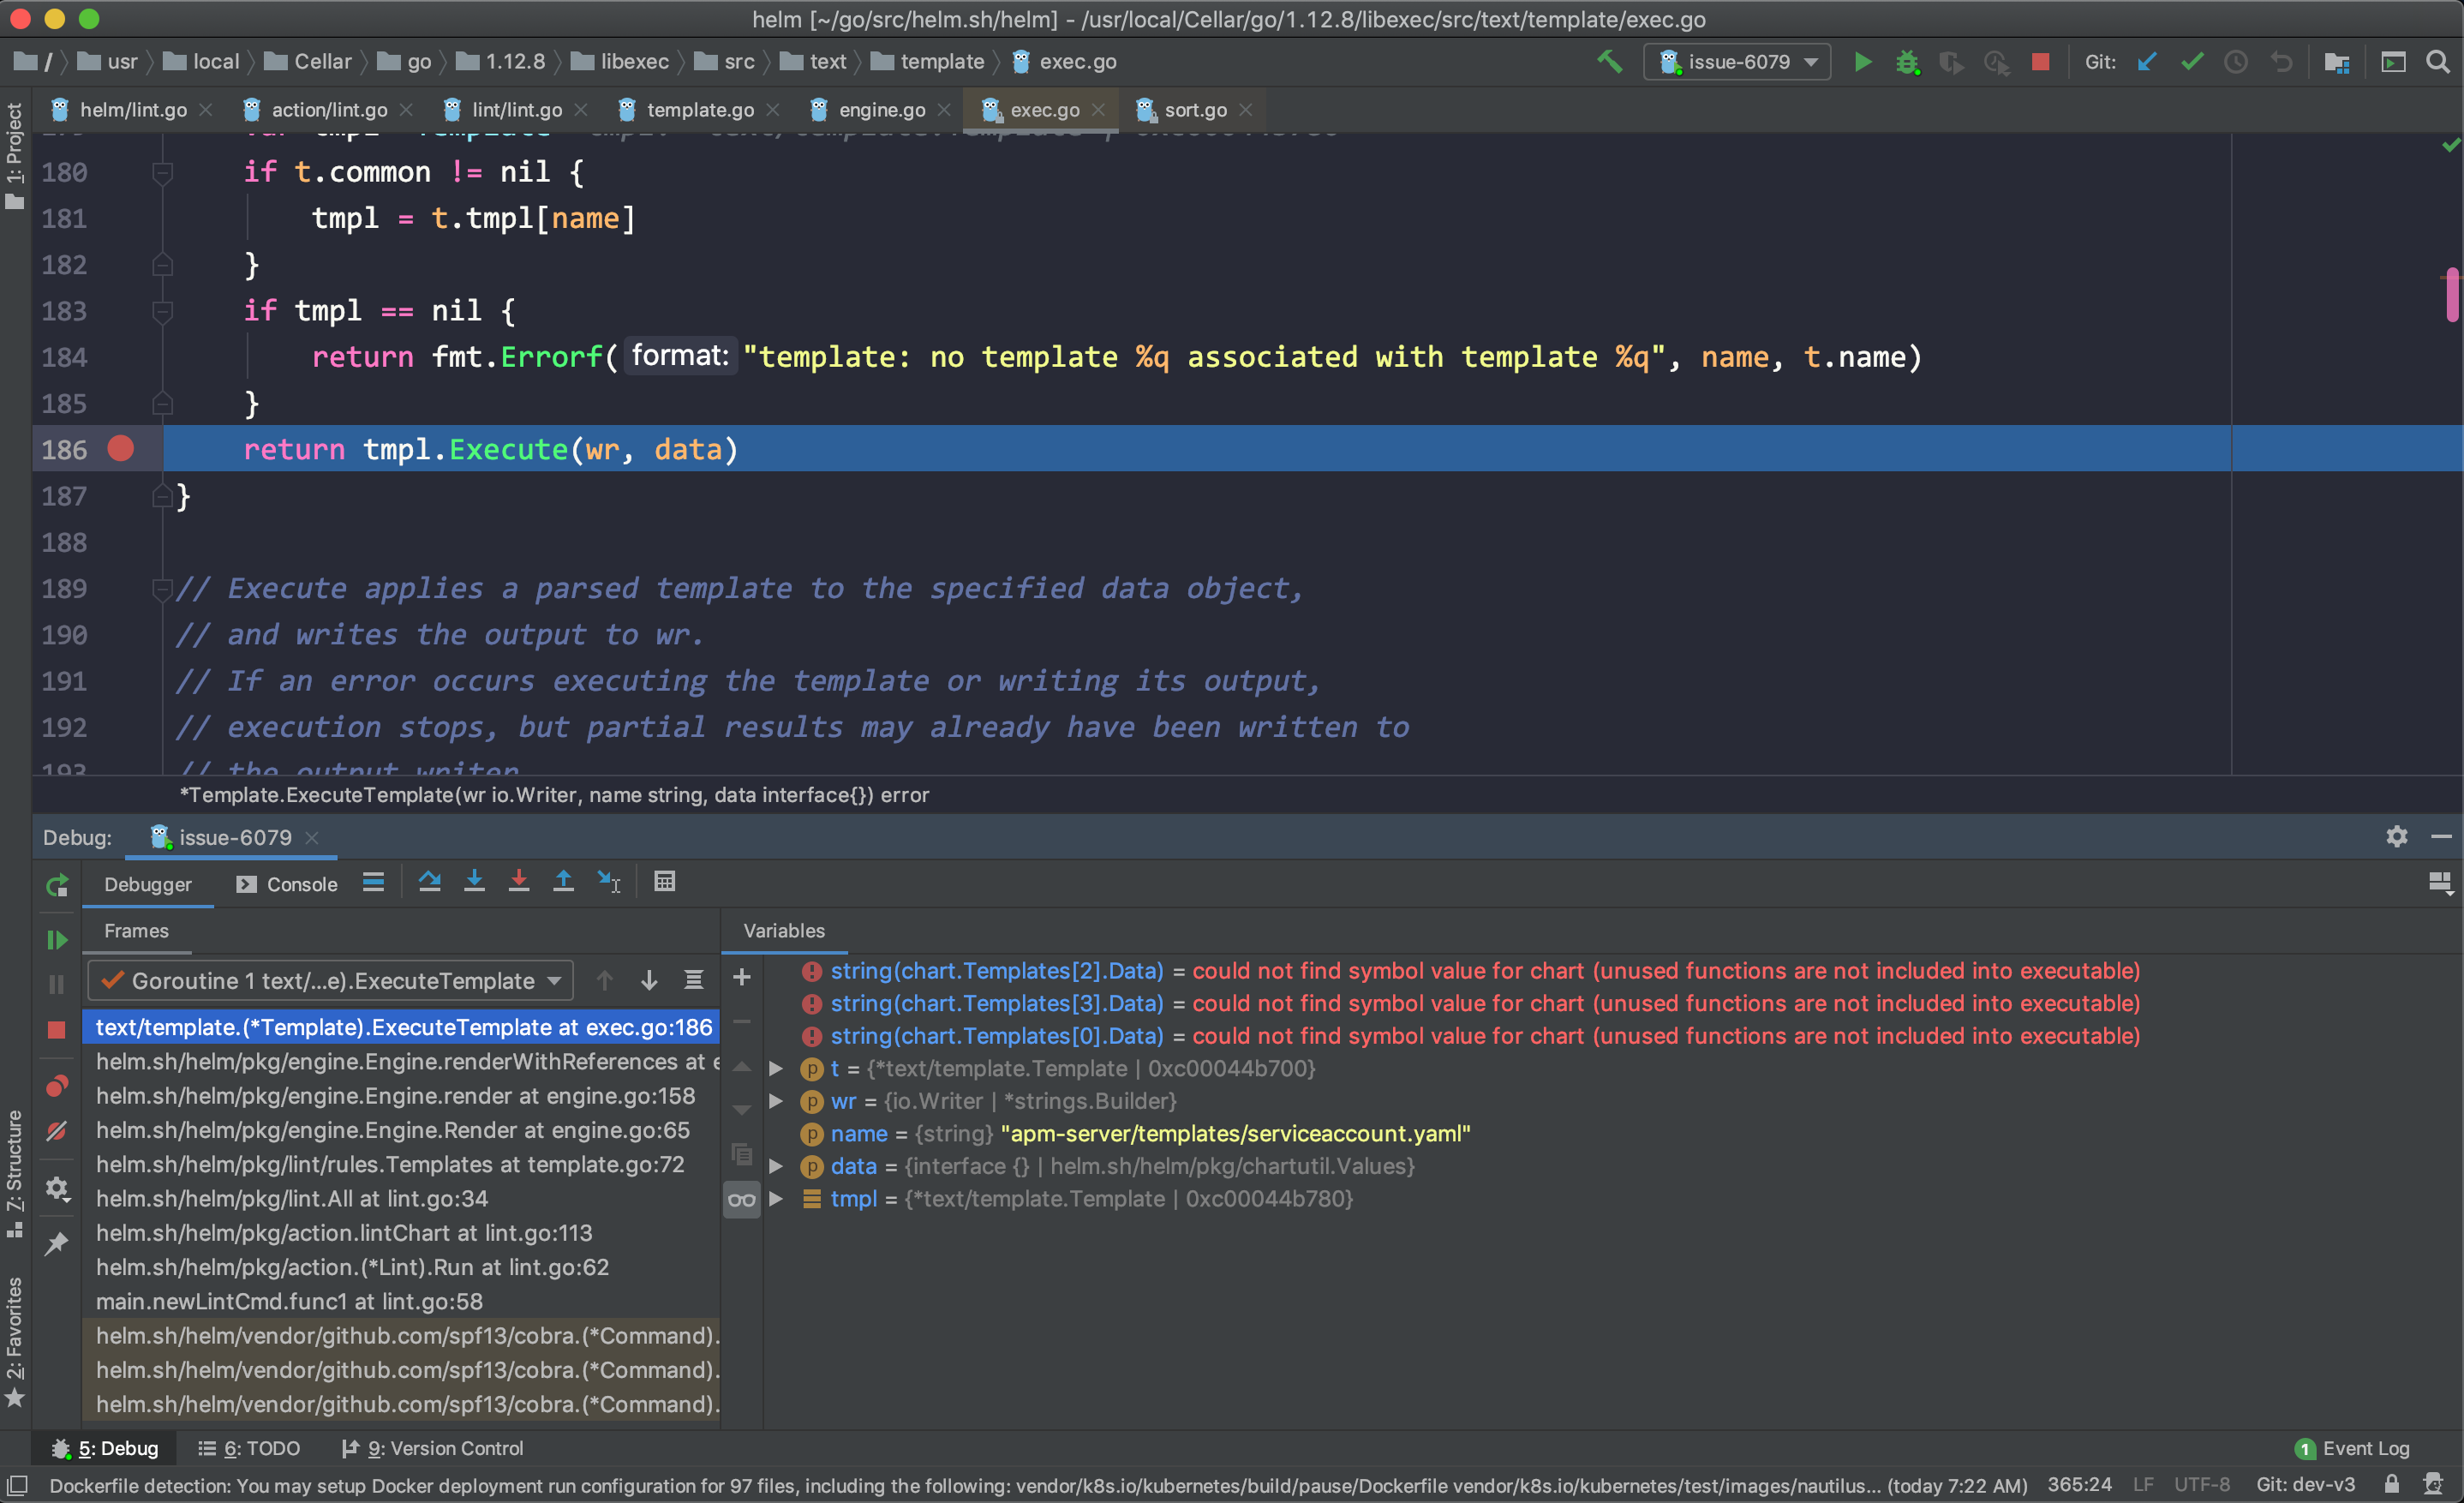
Here’s how the debug window looks like when on a breakpoint. This is the breakpoint in the text/template library. There are some watches for values in it, the value is not present in this context so it doesn’t show up here, but other values show up
So that’s how you debug a Go program. That’s all folks! If you have any questions shoot them below! 😄
Extra resource to read more on debugging in Intellij / GoLand - https://blog.jetbrains.com/go/2019/02/06/debugging-with-goland-getting-started/ . It mentions GoLand, but you can use the info to do the same things in Intellij