Debugging Go in Visual Studio Code
Long ago, in one post I wrote about how to debug Go program in Intellij IDEA / Goland. I realized not everyone uses IDEA ecosystem though, as they are paid. You could check out the IDEA community edition though, which is free. And you can install the Go plugin from here. In my case I used to use IDEA Ultimate and evaluate it (Evaluator version) for free, now I use a company license. But of course there are other text editors and IDEs that you can use to write Go code. One such famous one is Visual Studio Code (VS Code) as you might already know. I tried to debug the same helm issue as my last Intellij post using VS Code and checked how easy it was. Turns out it’s pretty easy and similar to IDEA. I just had to create a configuration and that’s it. Here are the steps that I followed :
Prerequisite - Make sure you have the Go extension installed in VS Code
Steps:
In the left bar, there will be a bug shaped icon, click it
![]()
Now you will see the debug side bar. Choose “Run and Debug” button in this
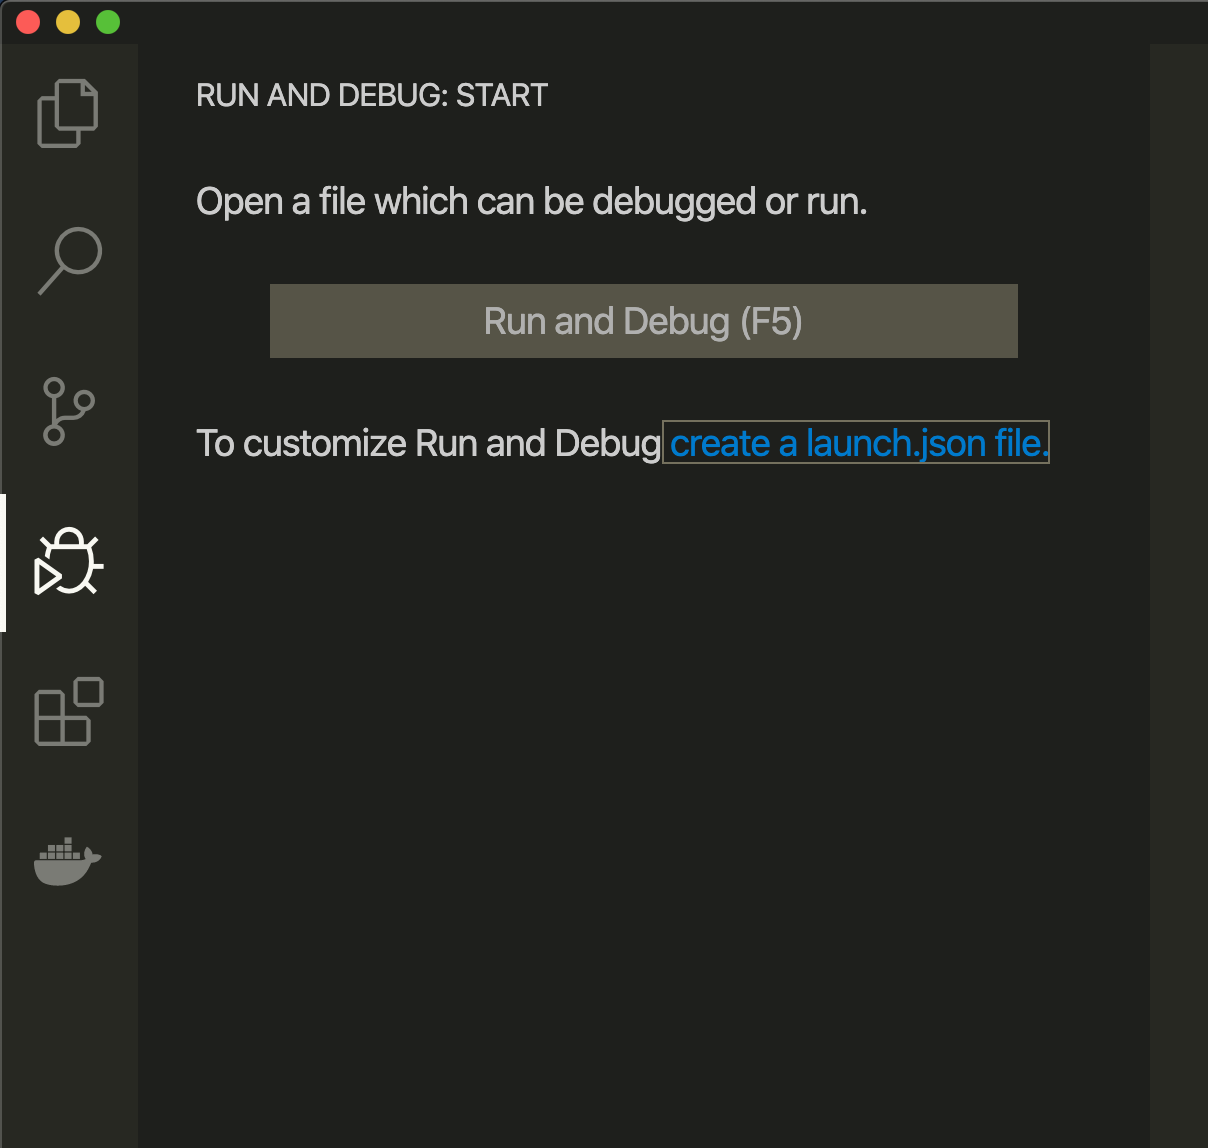
And then you can choose Go when it asks for what environment

Now, it will create a default launch.json file for you inside .vscode directory in the root of your
project. It will look like this
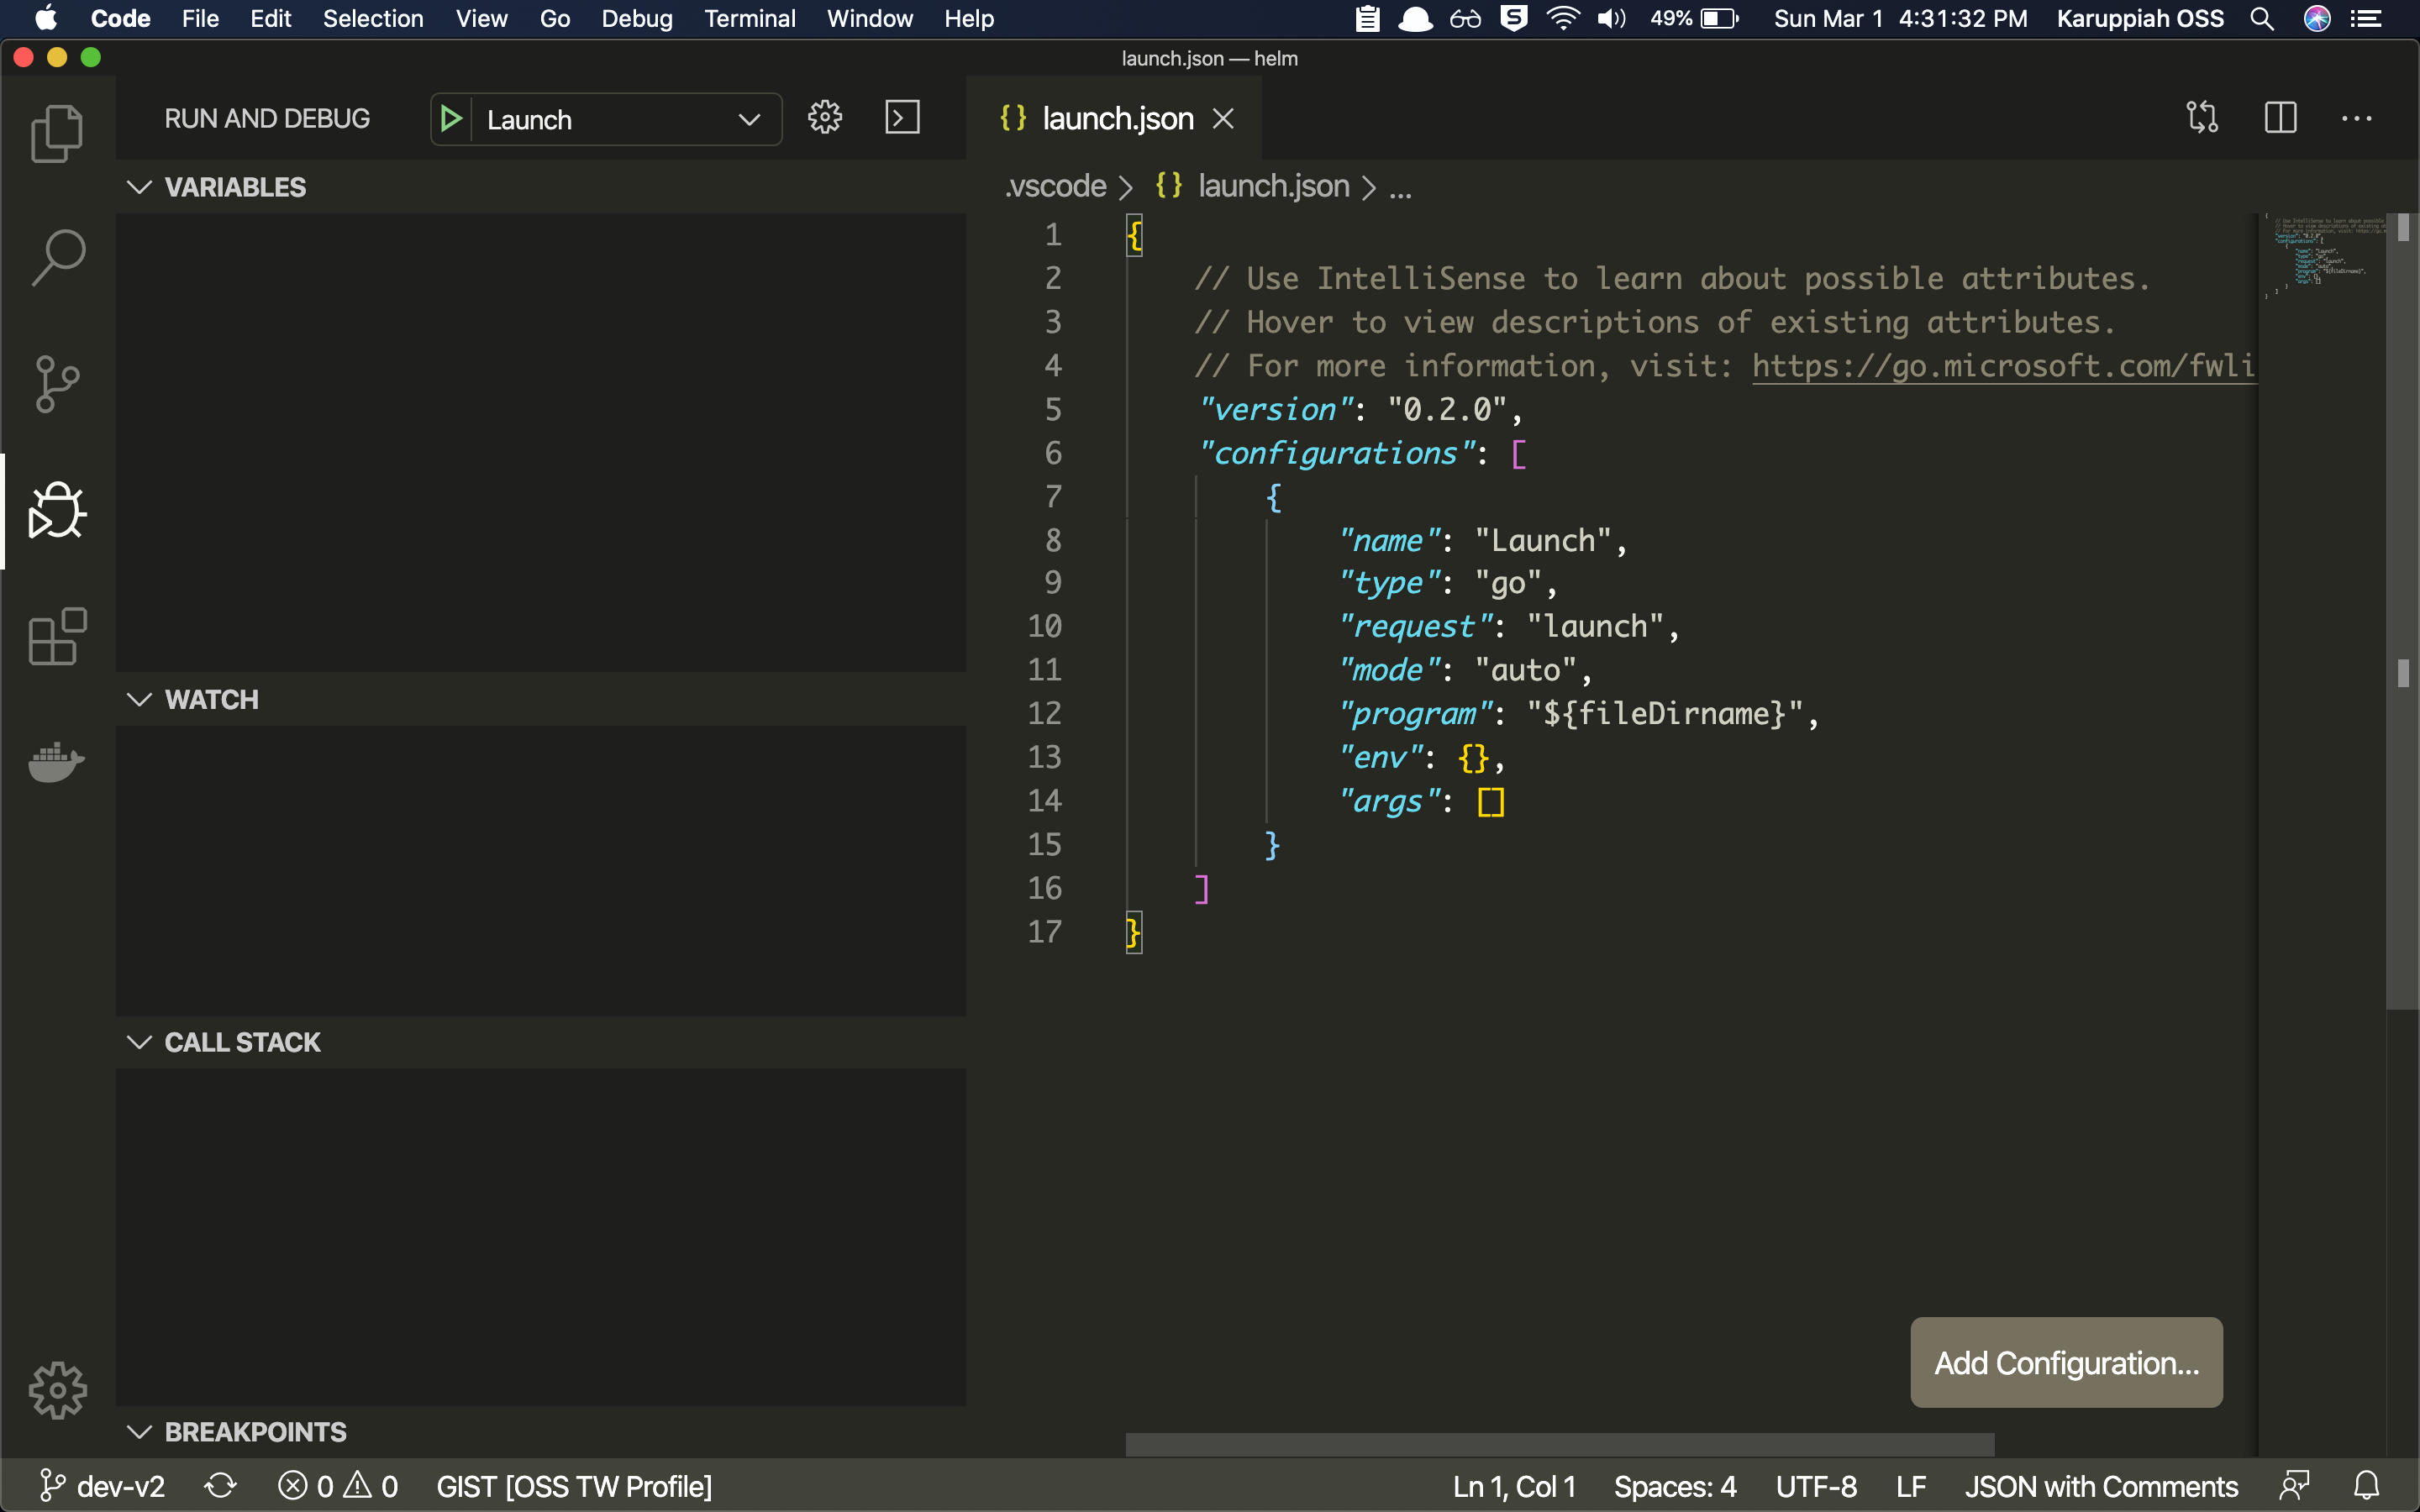
For my use case, I modified it like this
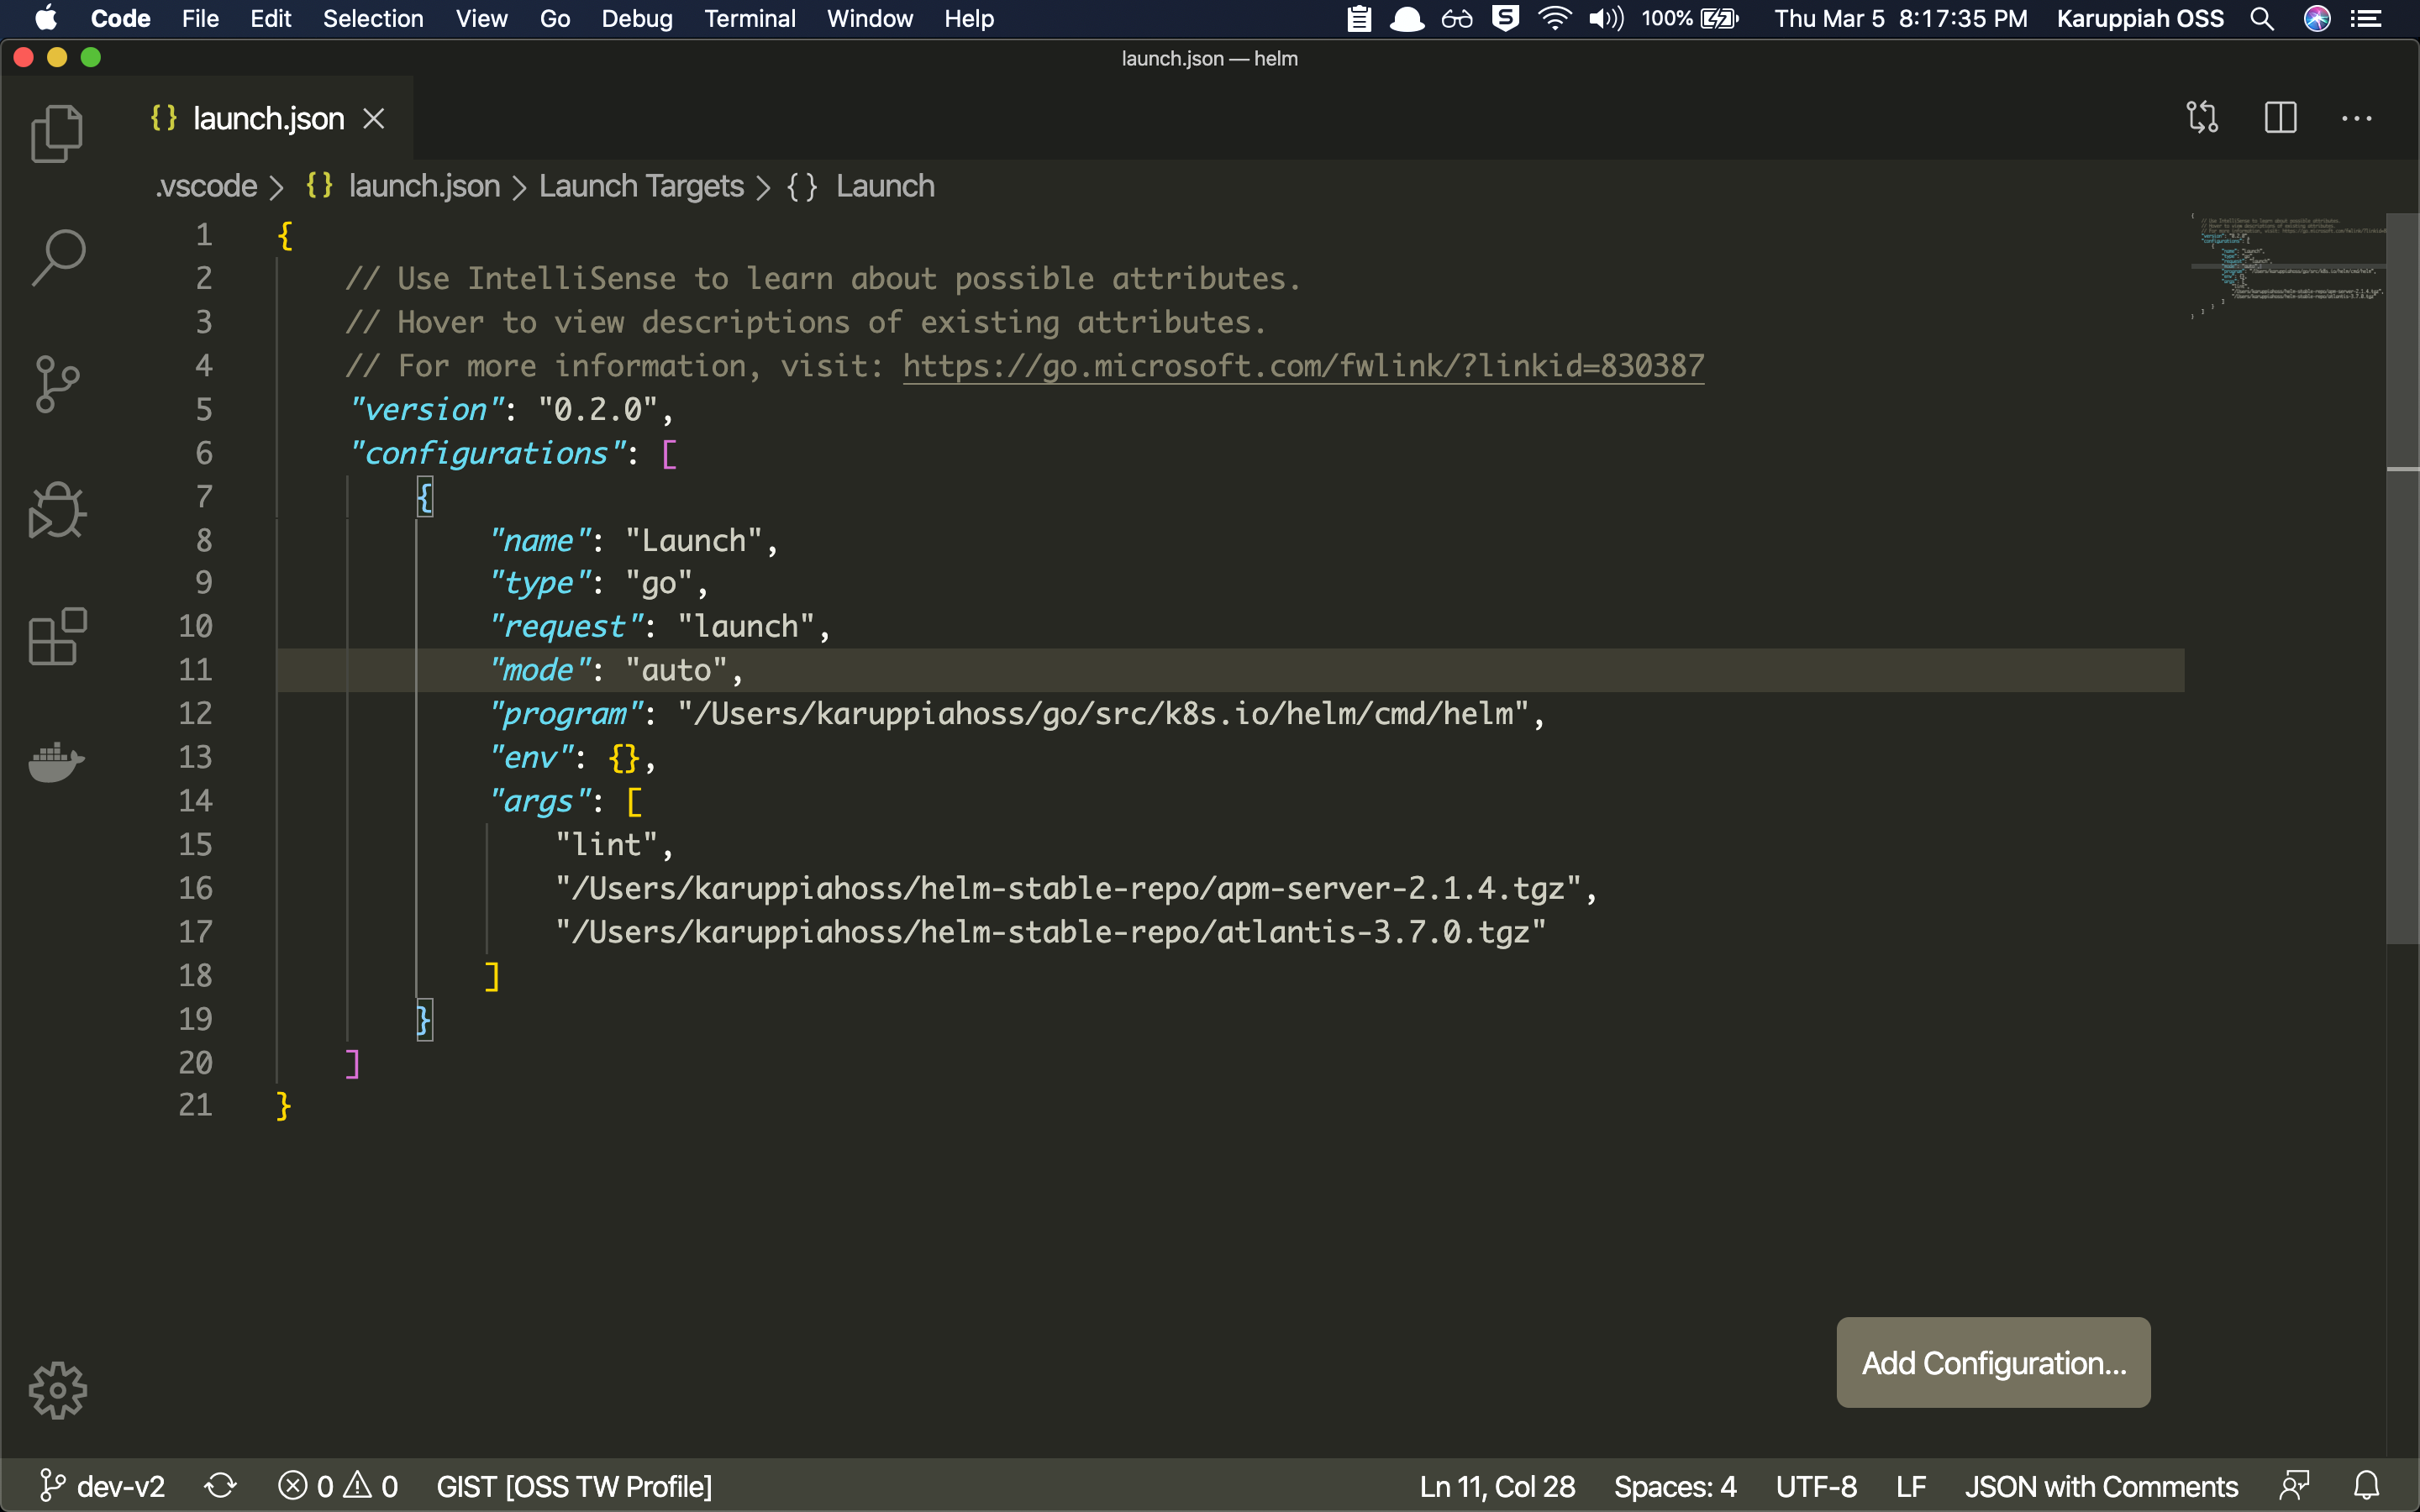
There are multiple configurations that you can provide. For example, you can provide the program arguments like in the above example. I used it to debug a linting issue hence the lint subcommand, so VS Code will run something like
$ helm lint /Users/karuppiahoss/helm-stable-repo/apm-server-2.1.4.tgz /Users/karuppiahoss/helm-stable-repo/atlantis-3.7.0.tgz
Now, once the configuration is done, you are good to go and debug your program ;)
Now you can run and debug it with the play icon button in the debug side bar. Before debugging you need to add breakpoints to your program code - wherever you want to stop the program and see the data present in the variables and you can evaluate expressions too!
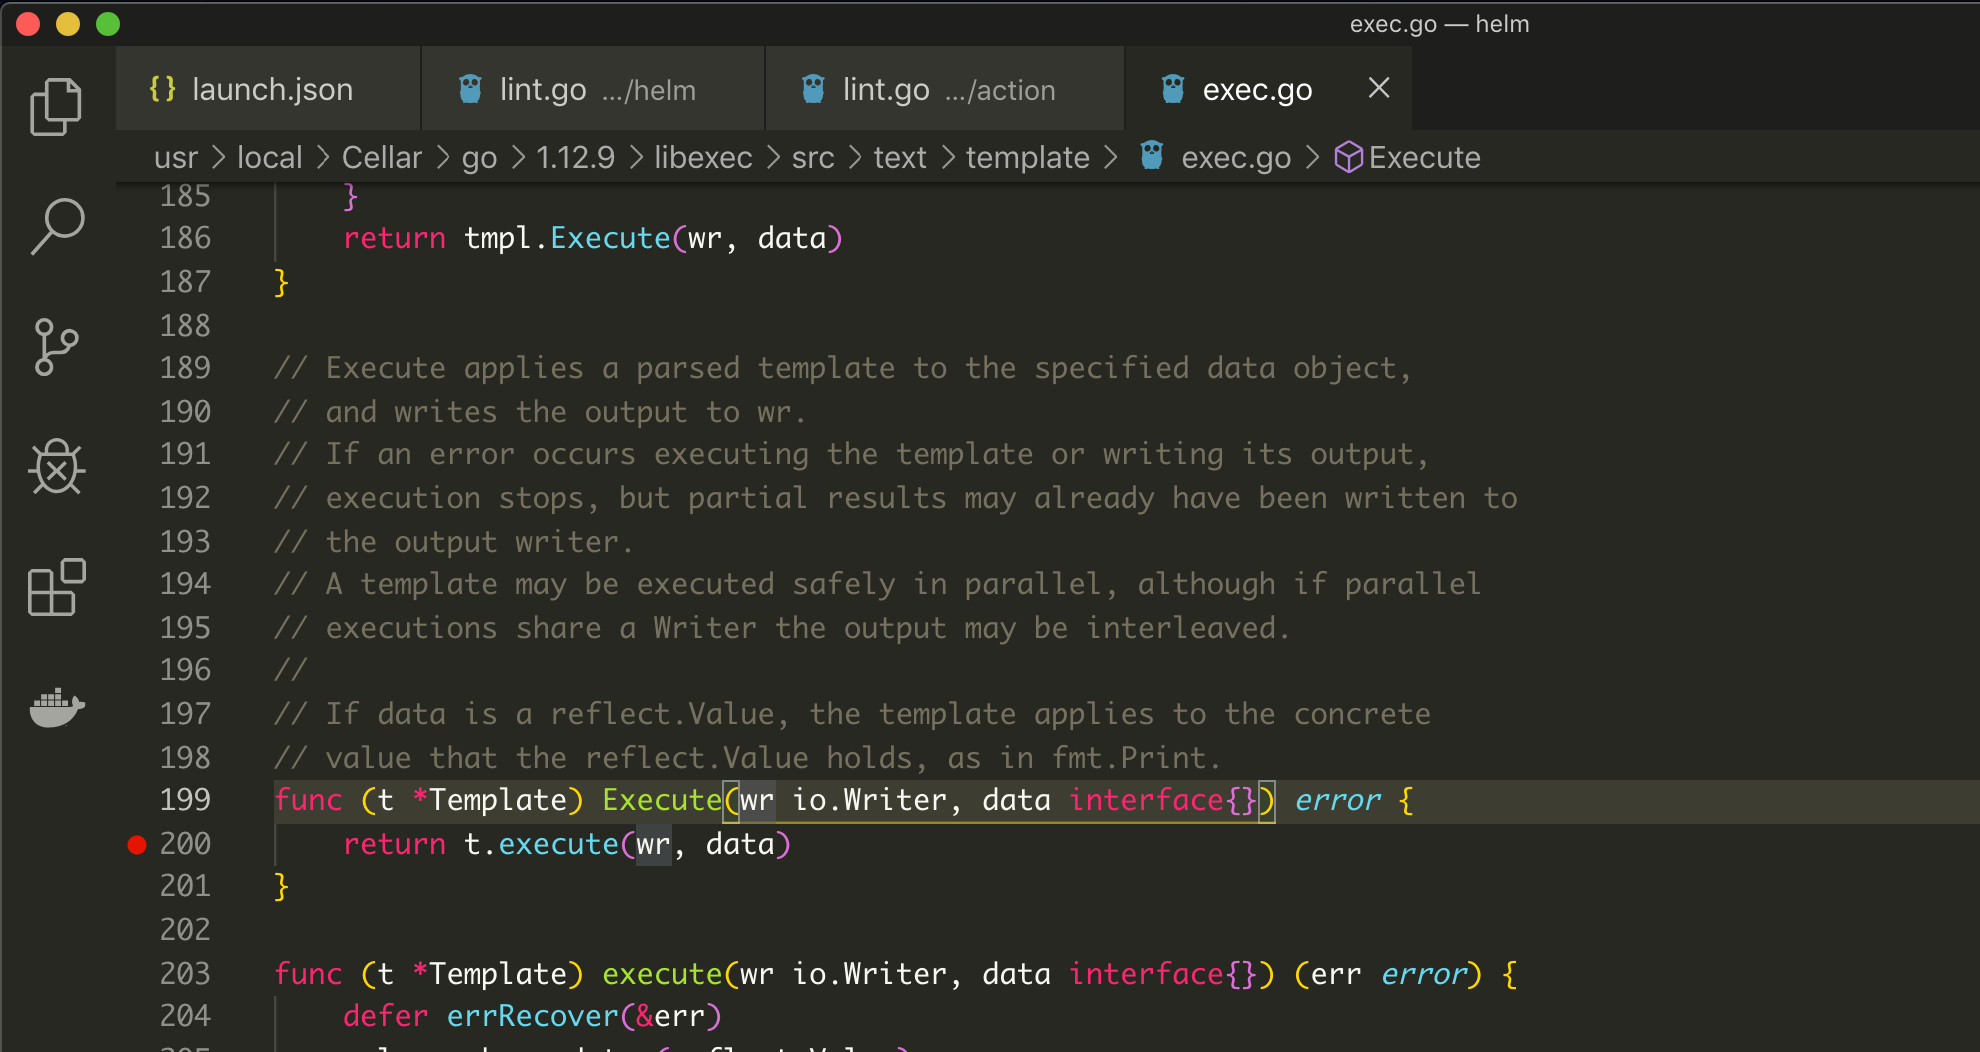
And while debugging you can add breakpoints on the go and you can add breakpoints anywhere in the program execution! Like even in the standard library code execution! See below for examples of putting breakpoints and how I have put breakpoints in the template golang stdblib
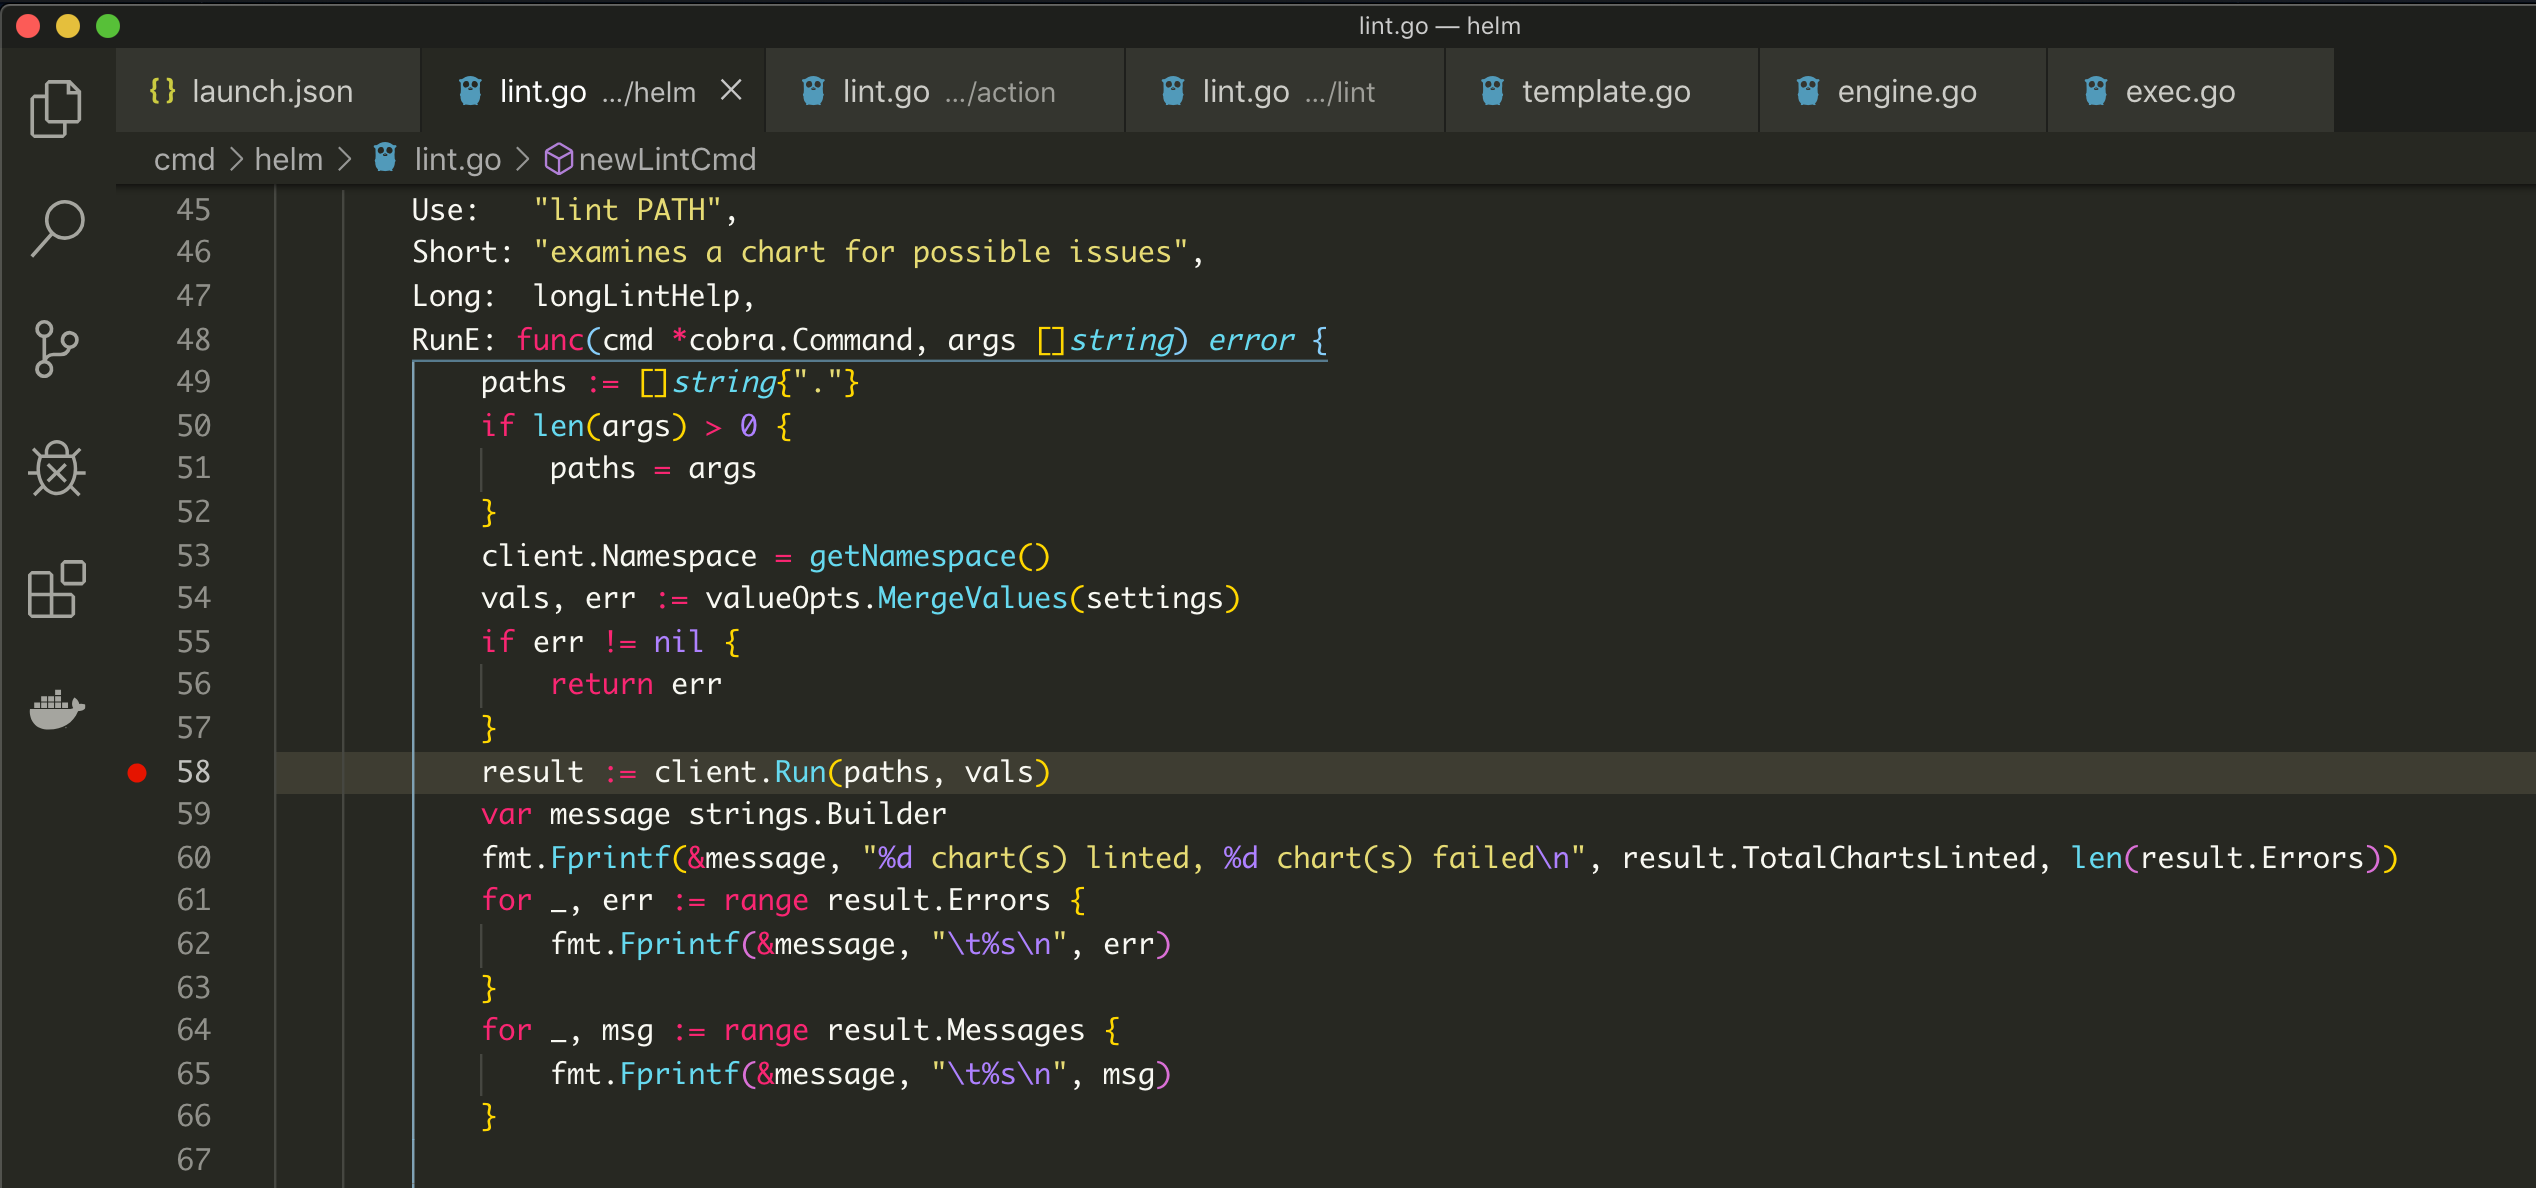
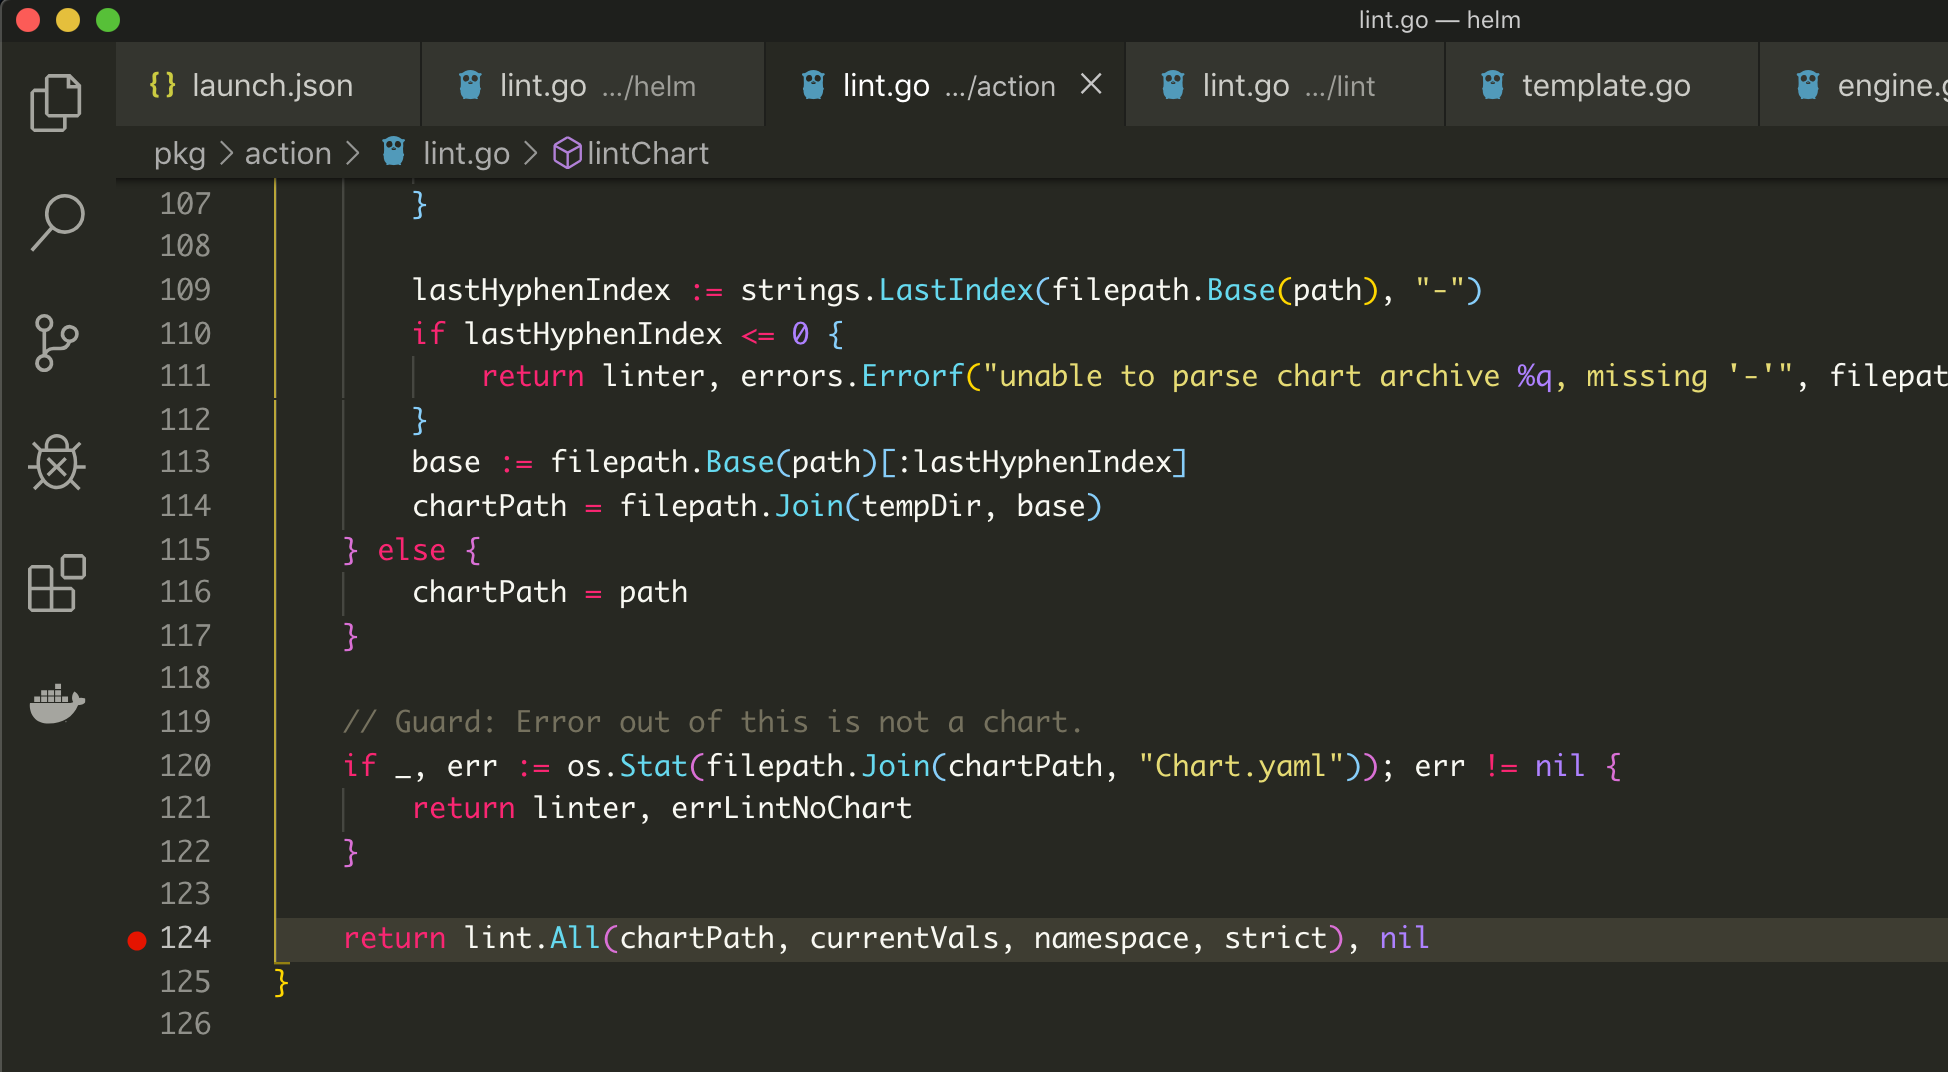
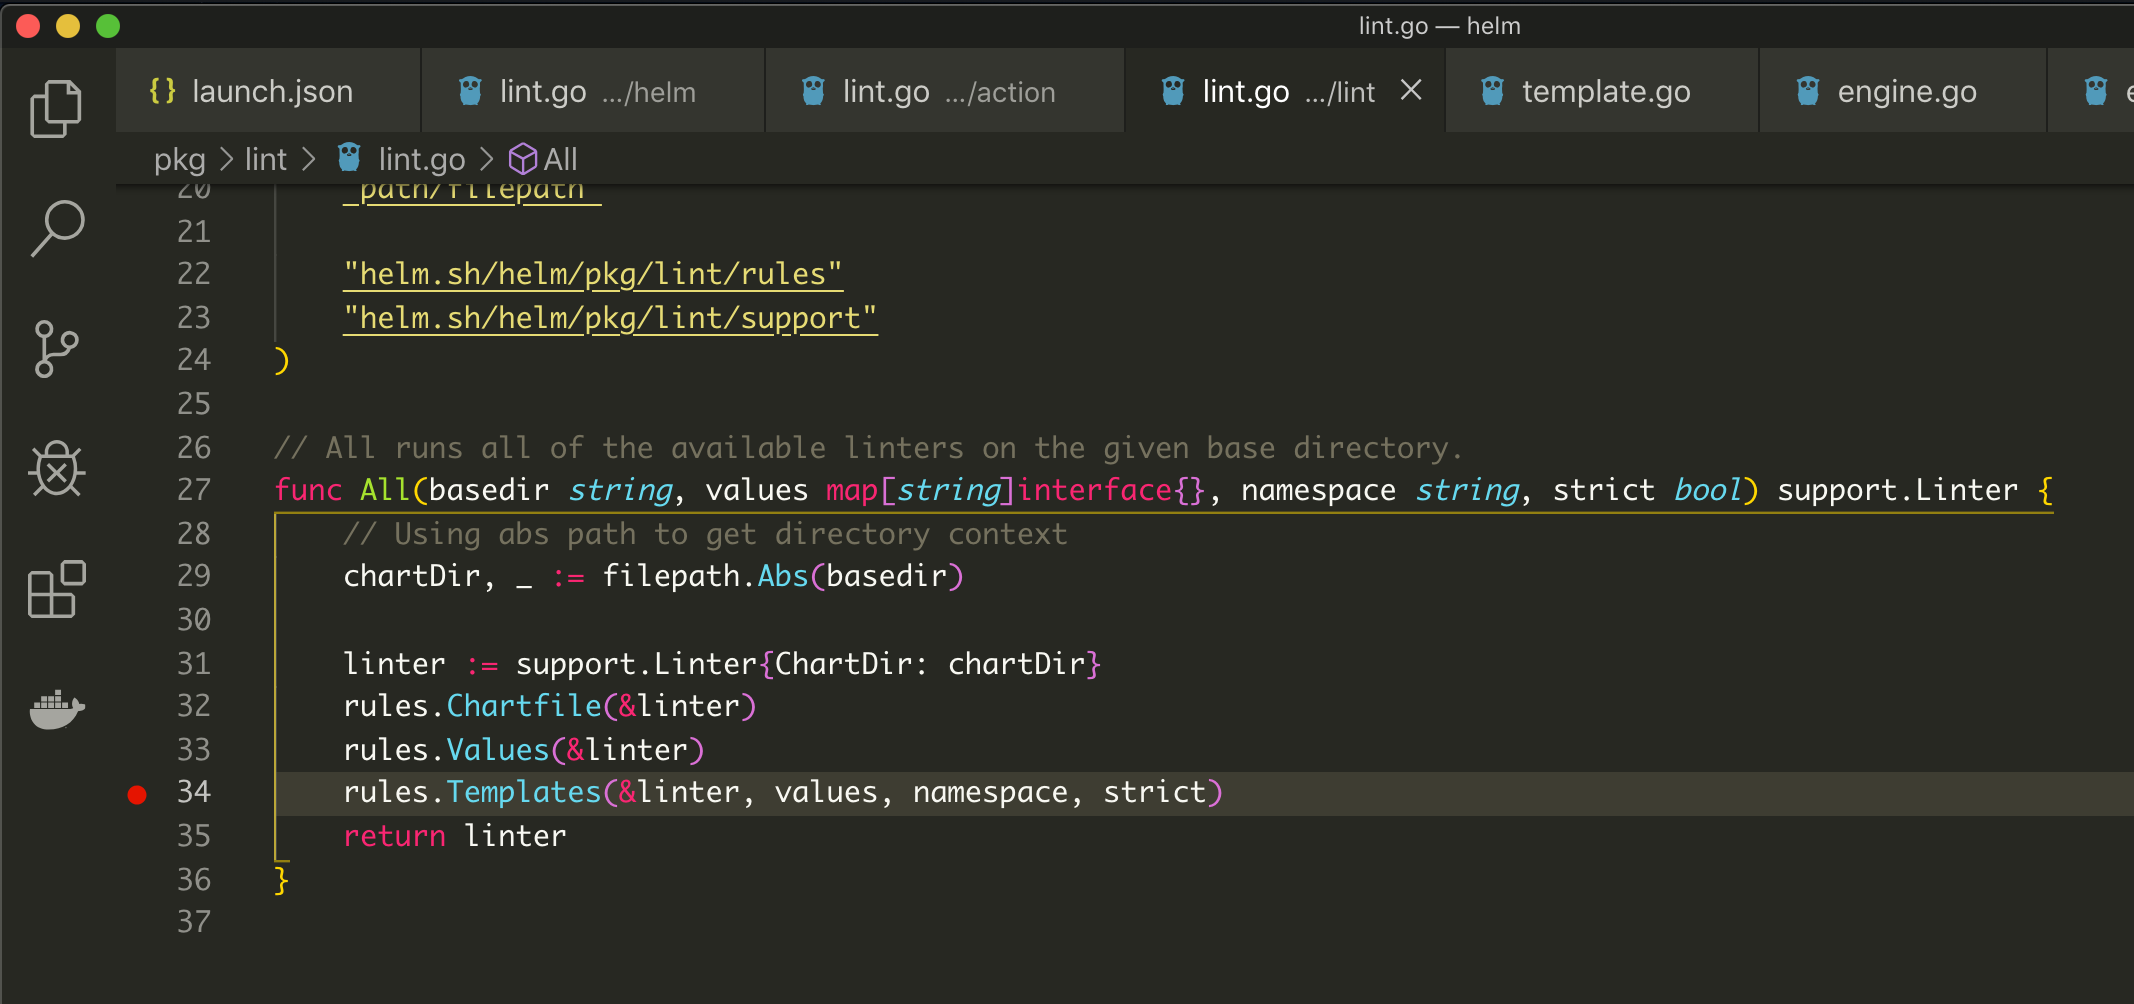
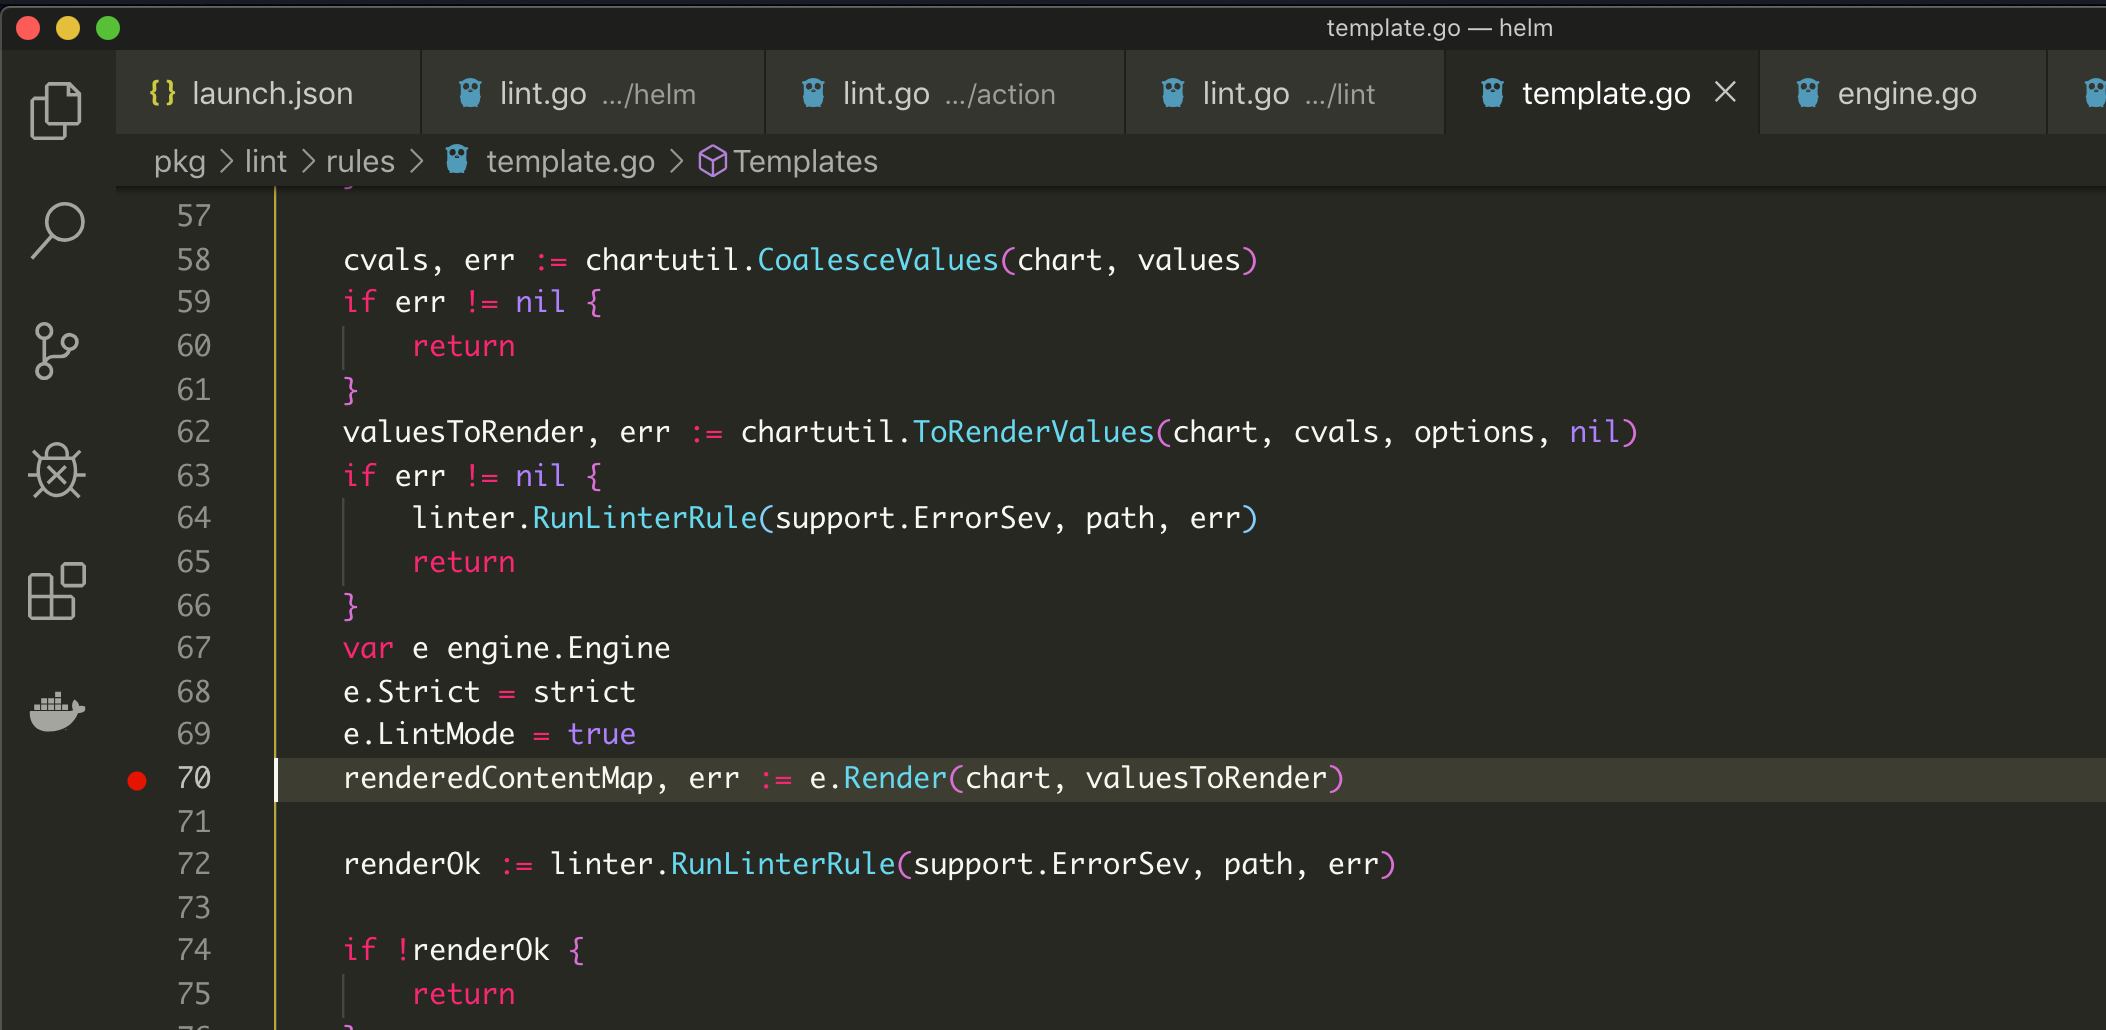
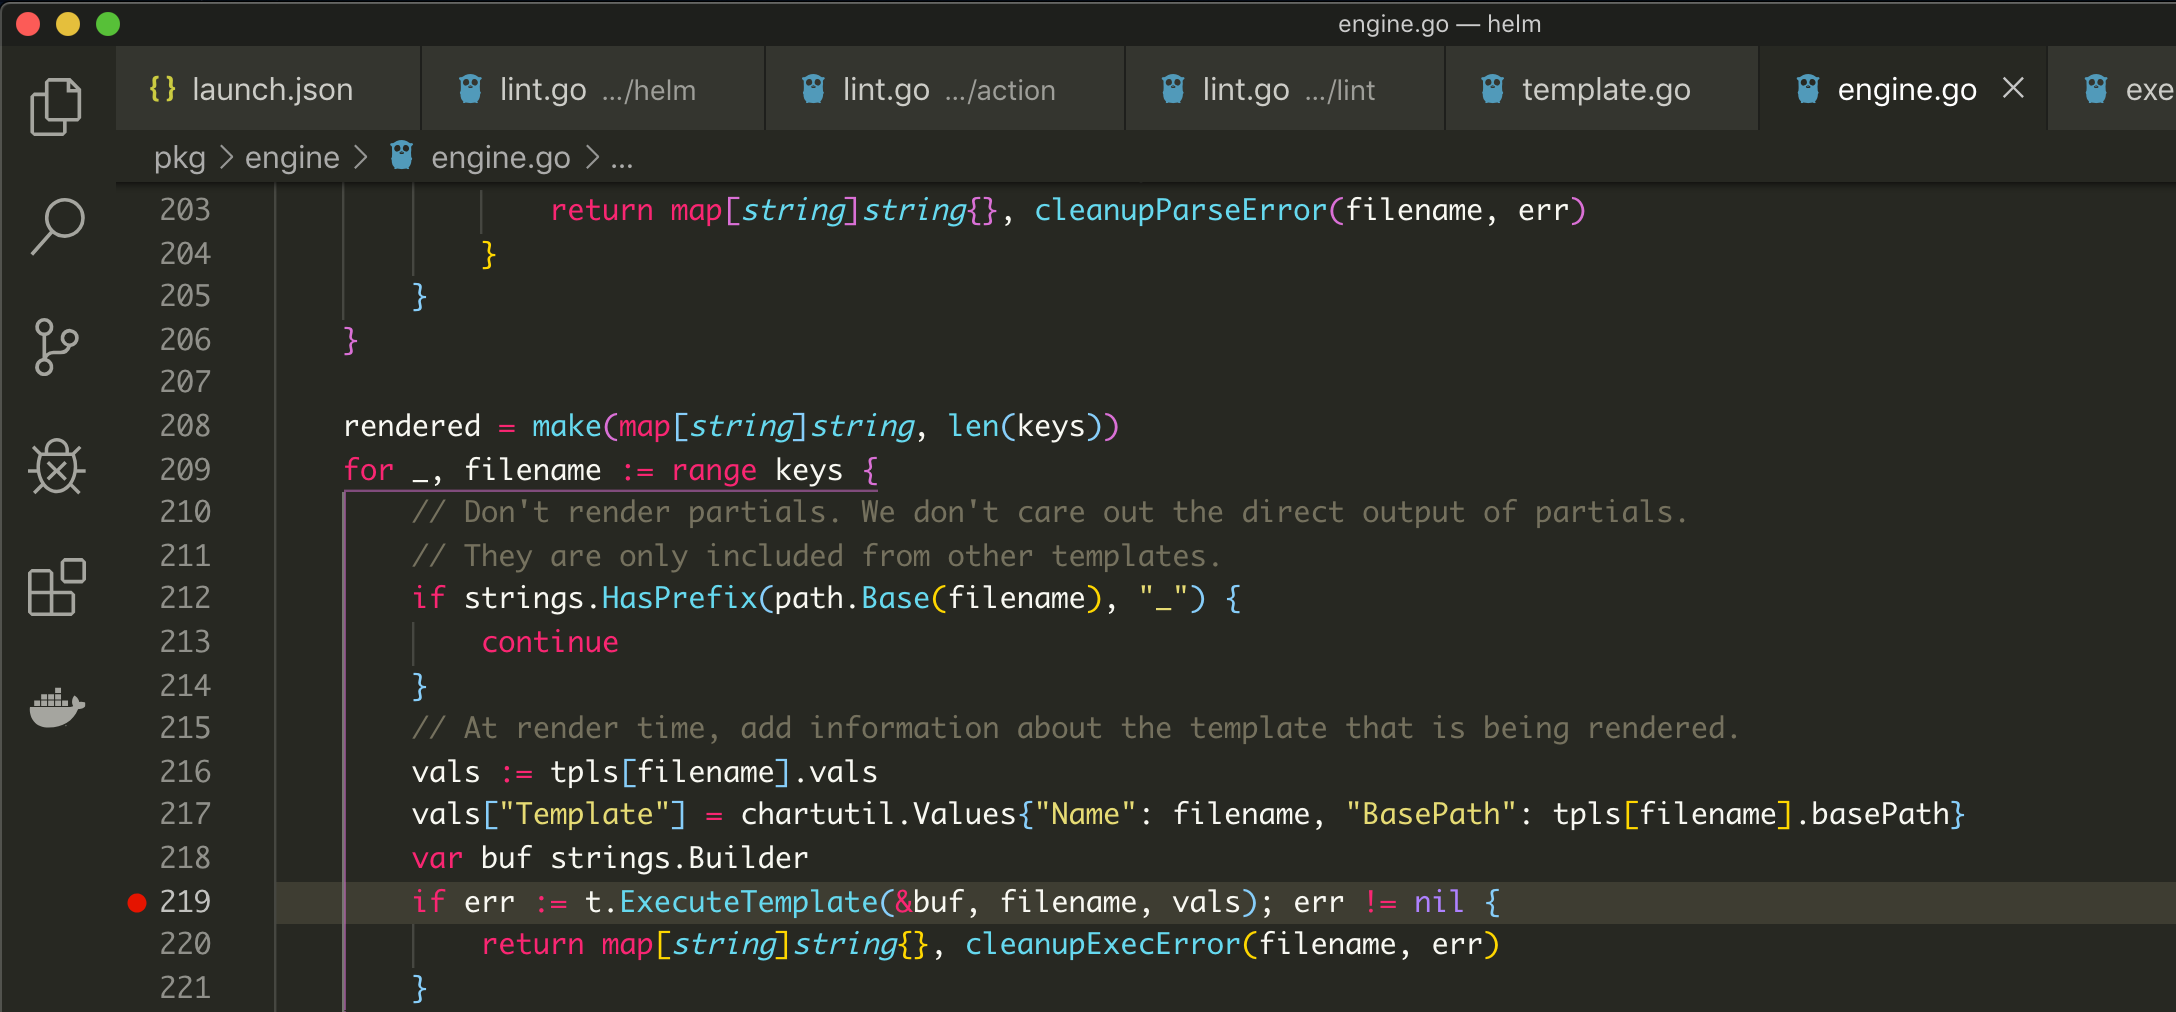
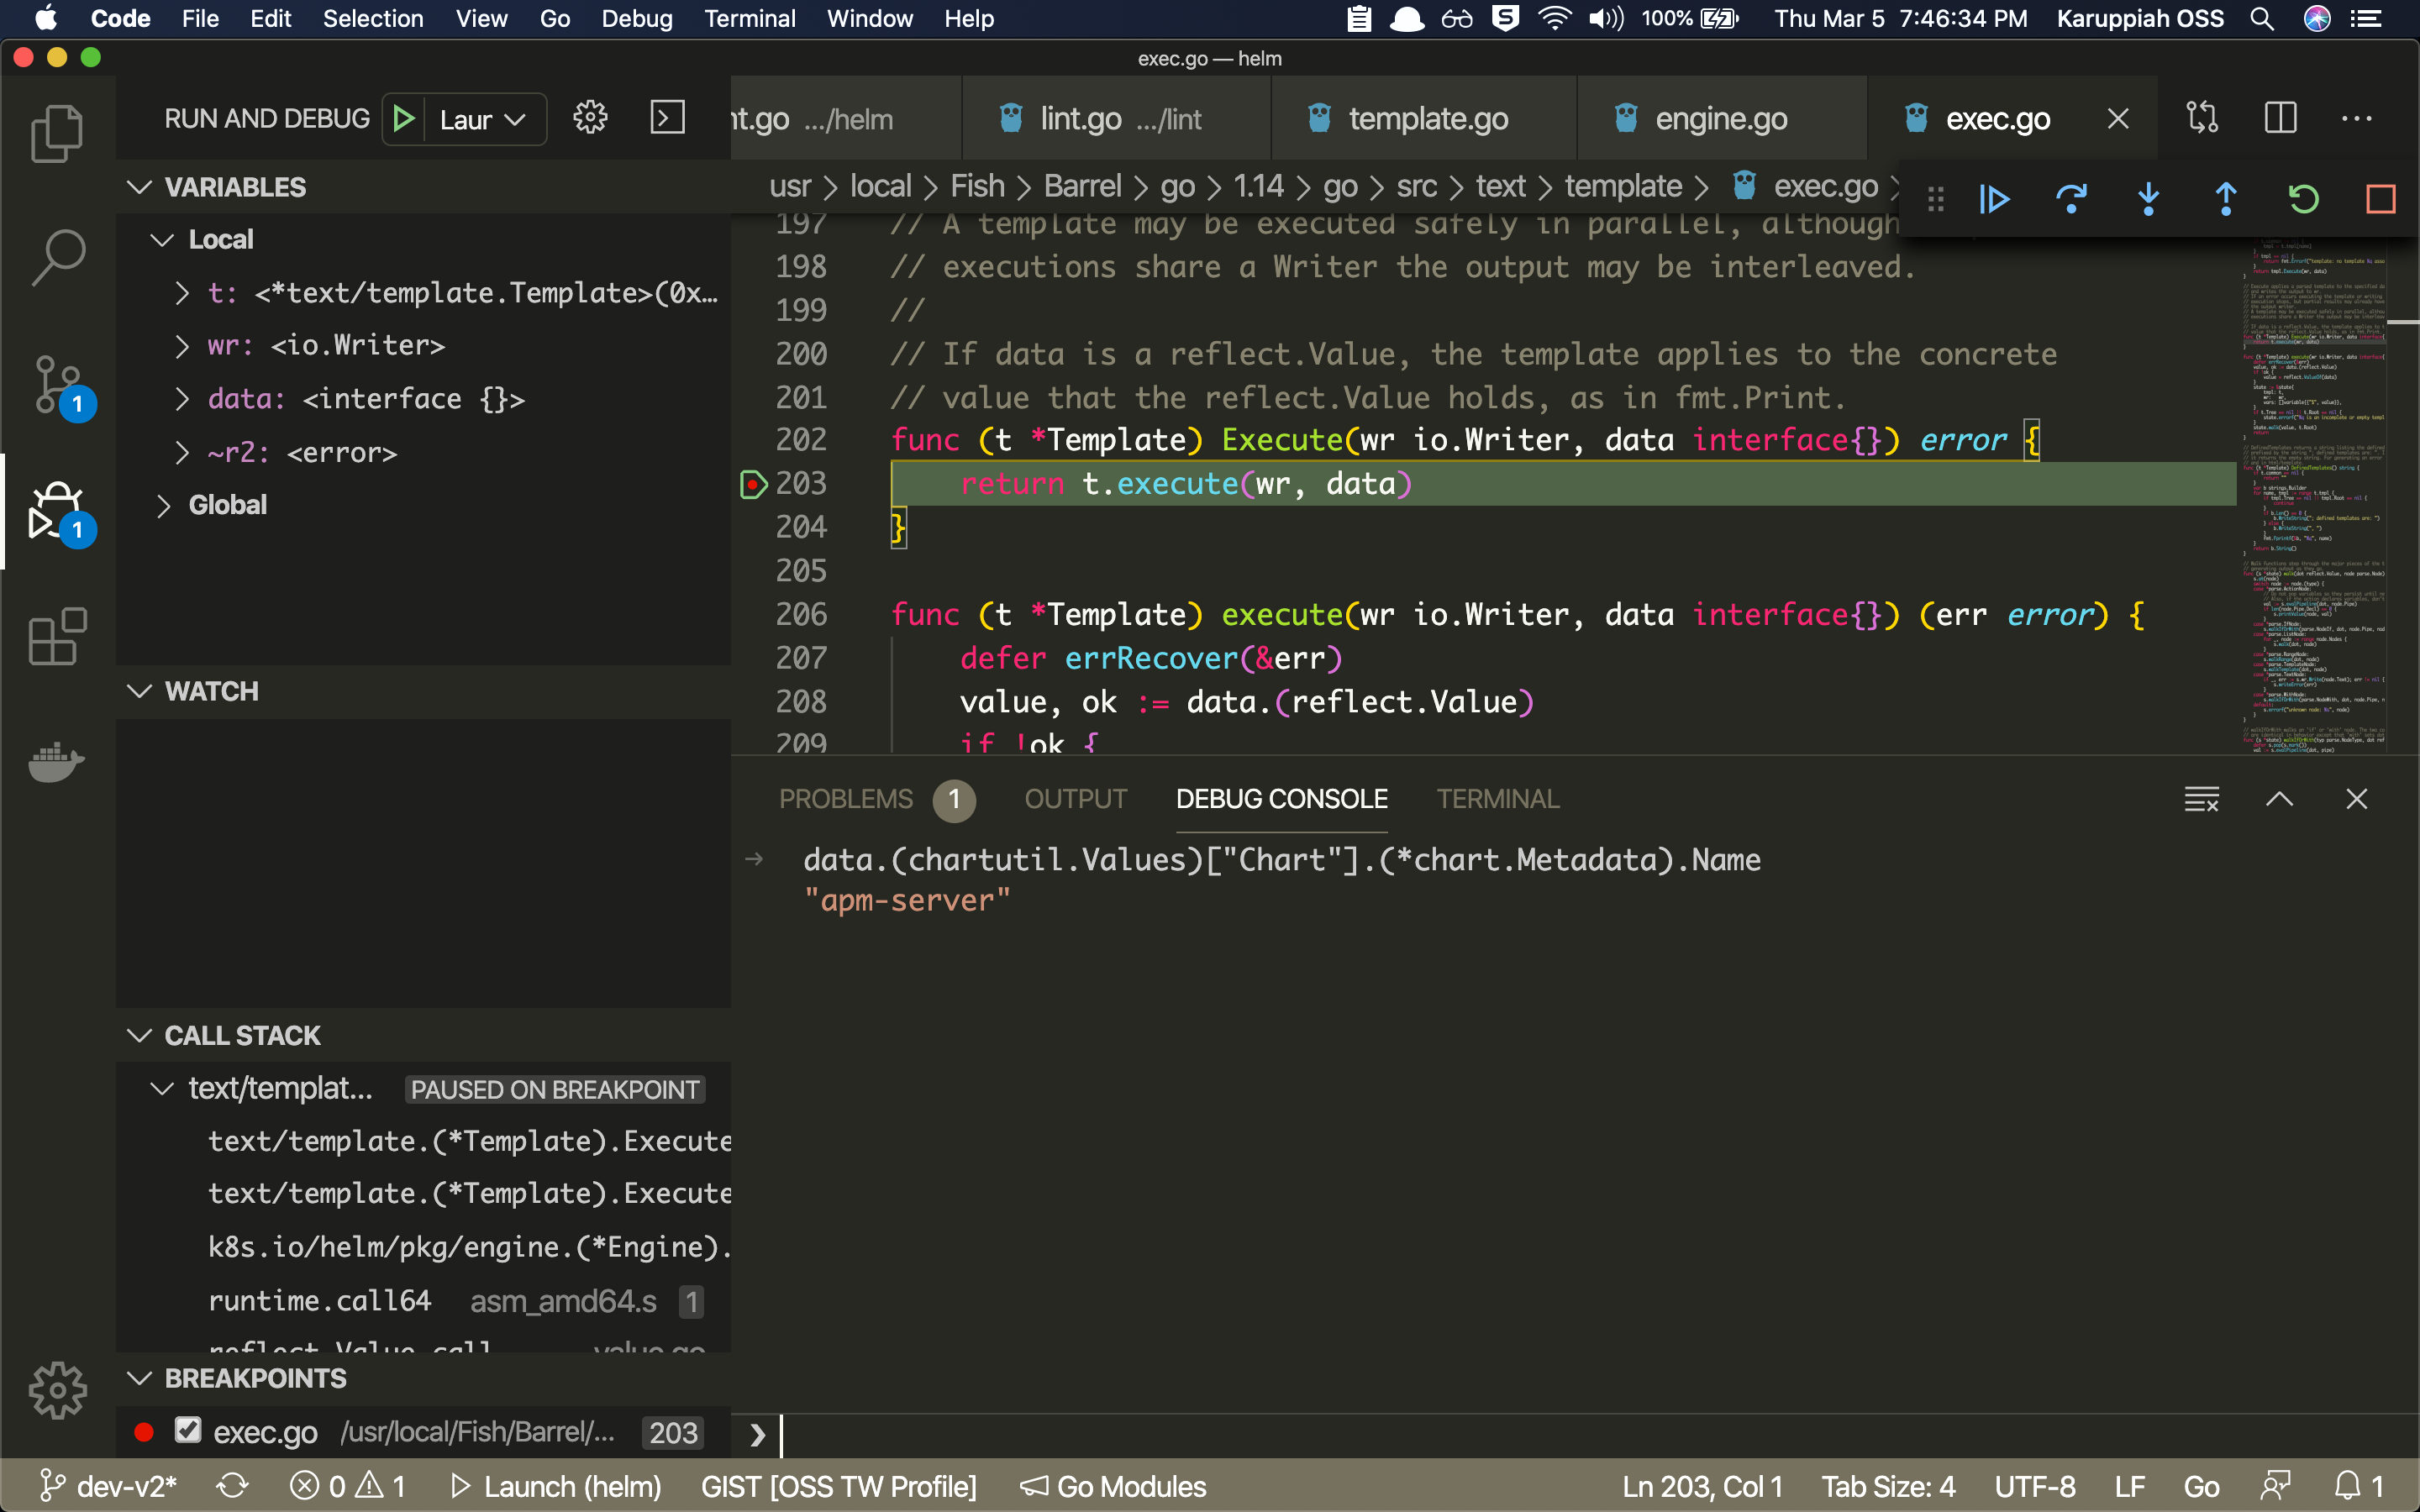
If you notice the image below (the VS code breadcrumb path), I have a breakpoint in the golang standard library packages text/template
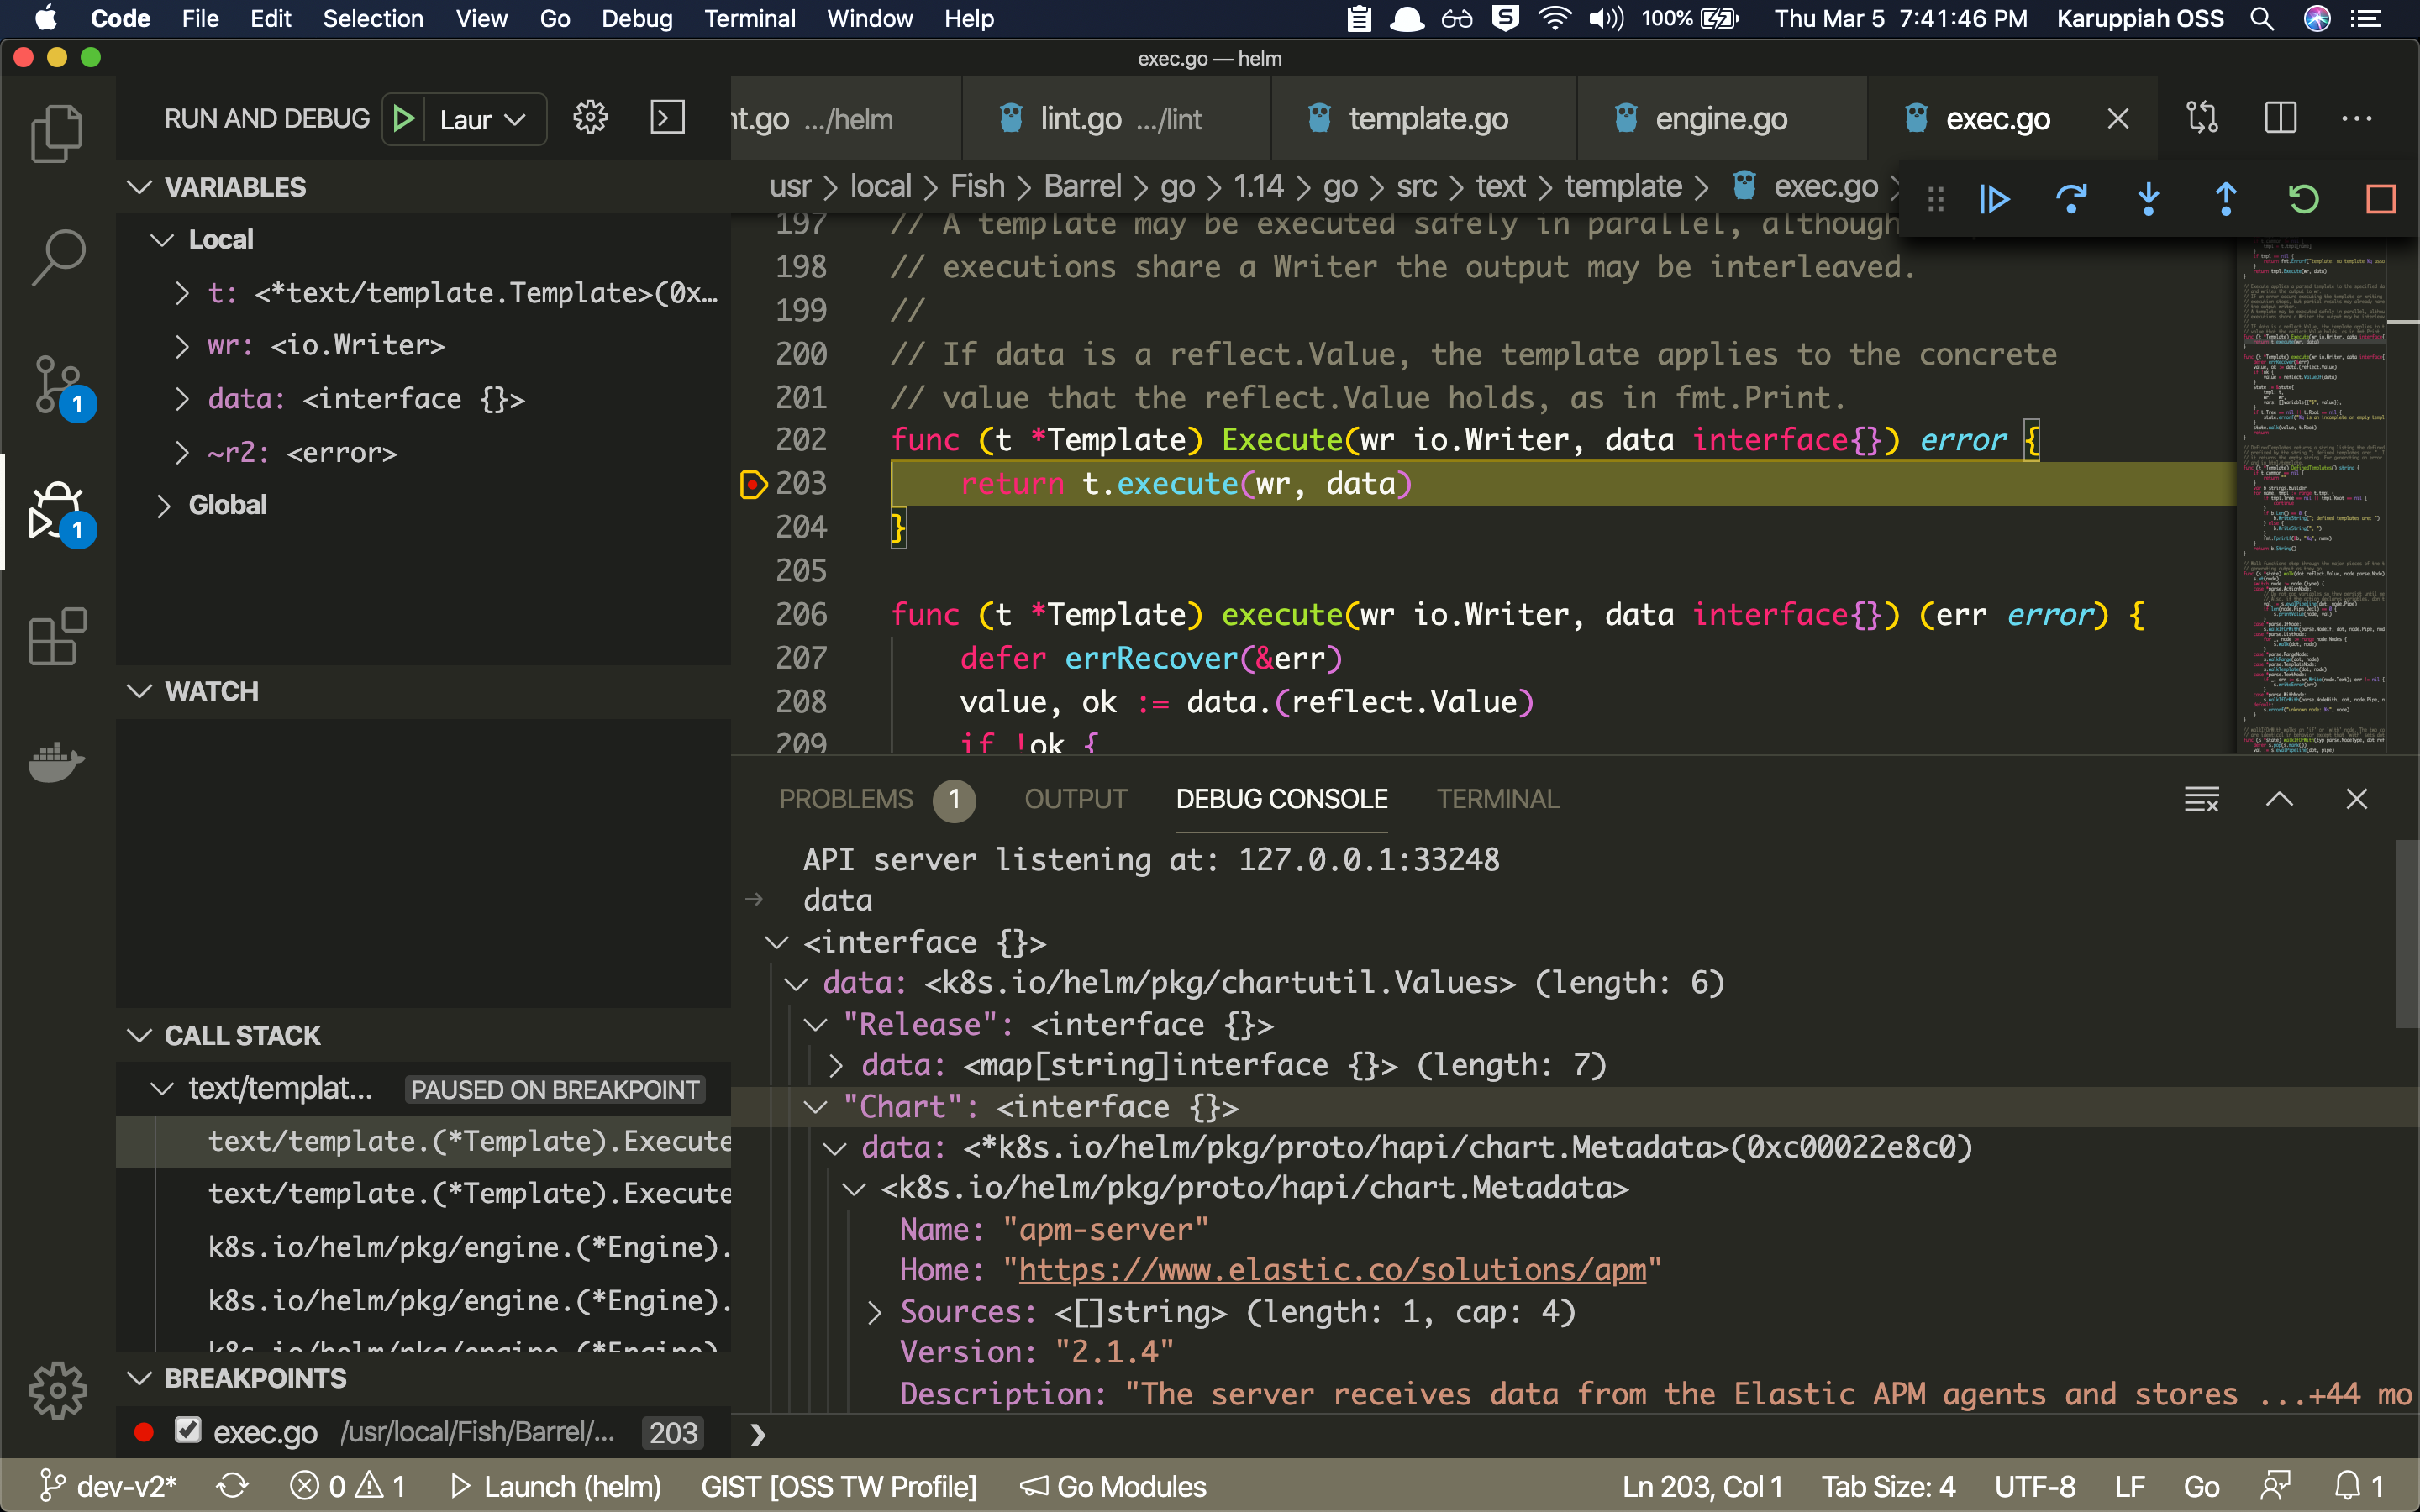
Here’s how the debug window looks like when on a breakpoint. This is the breakpoint in the text/template library.
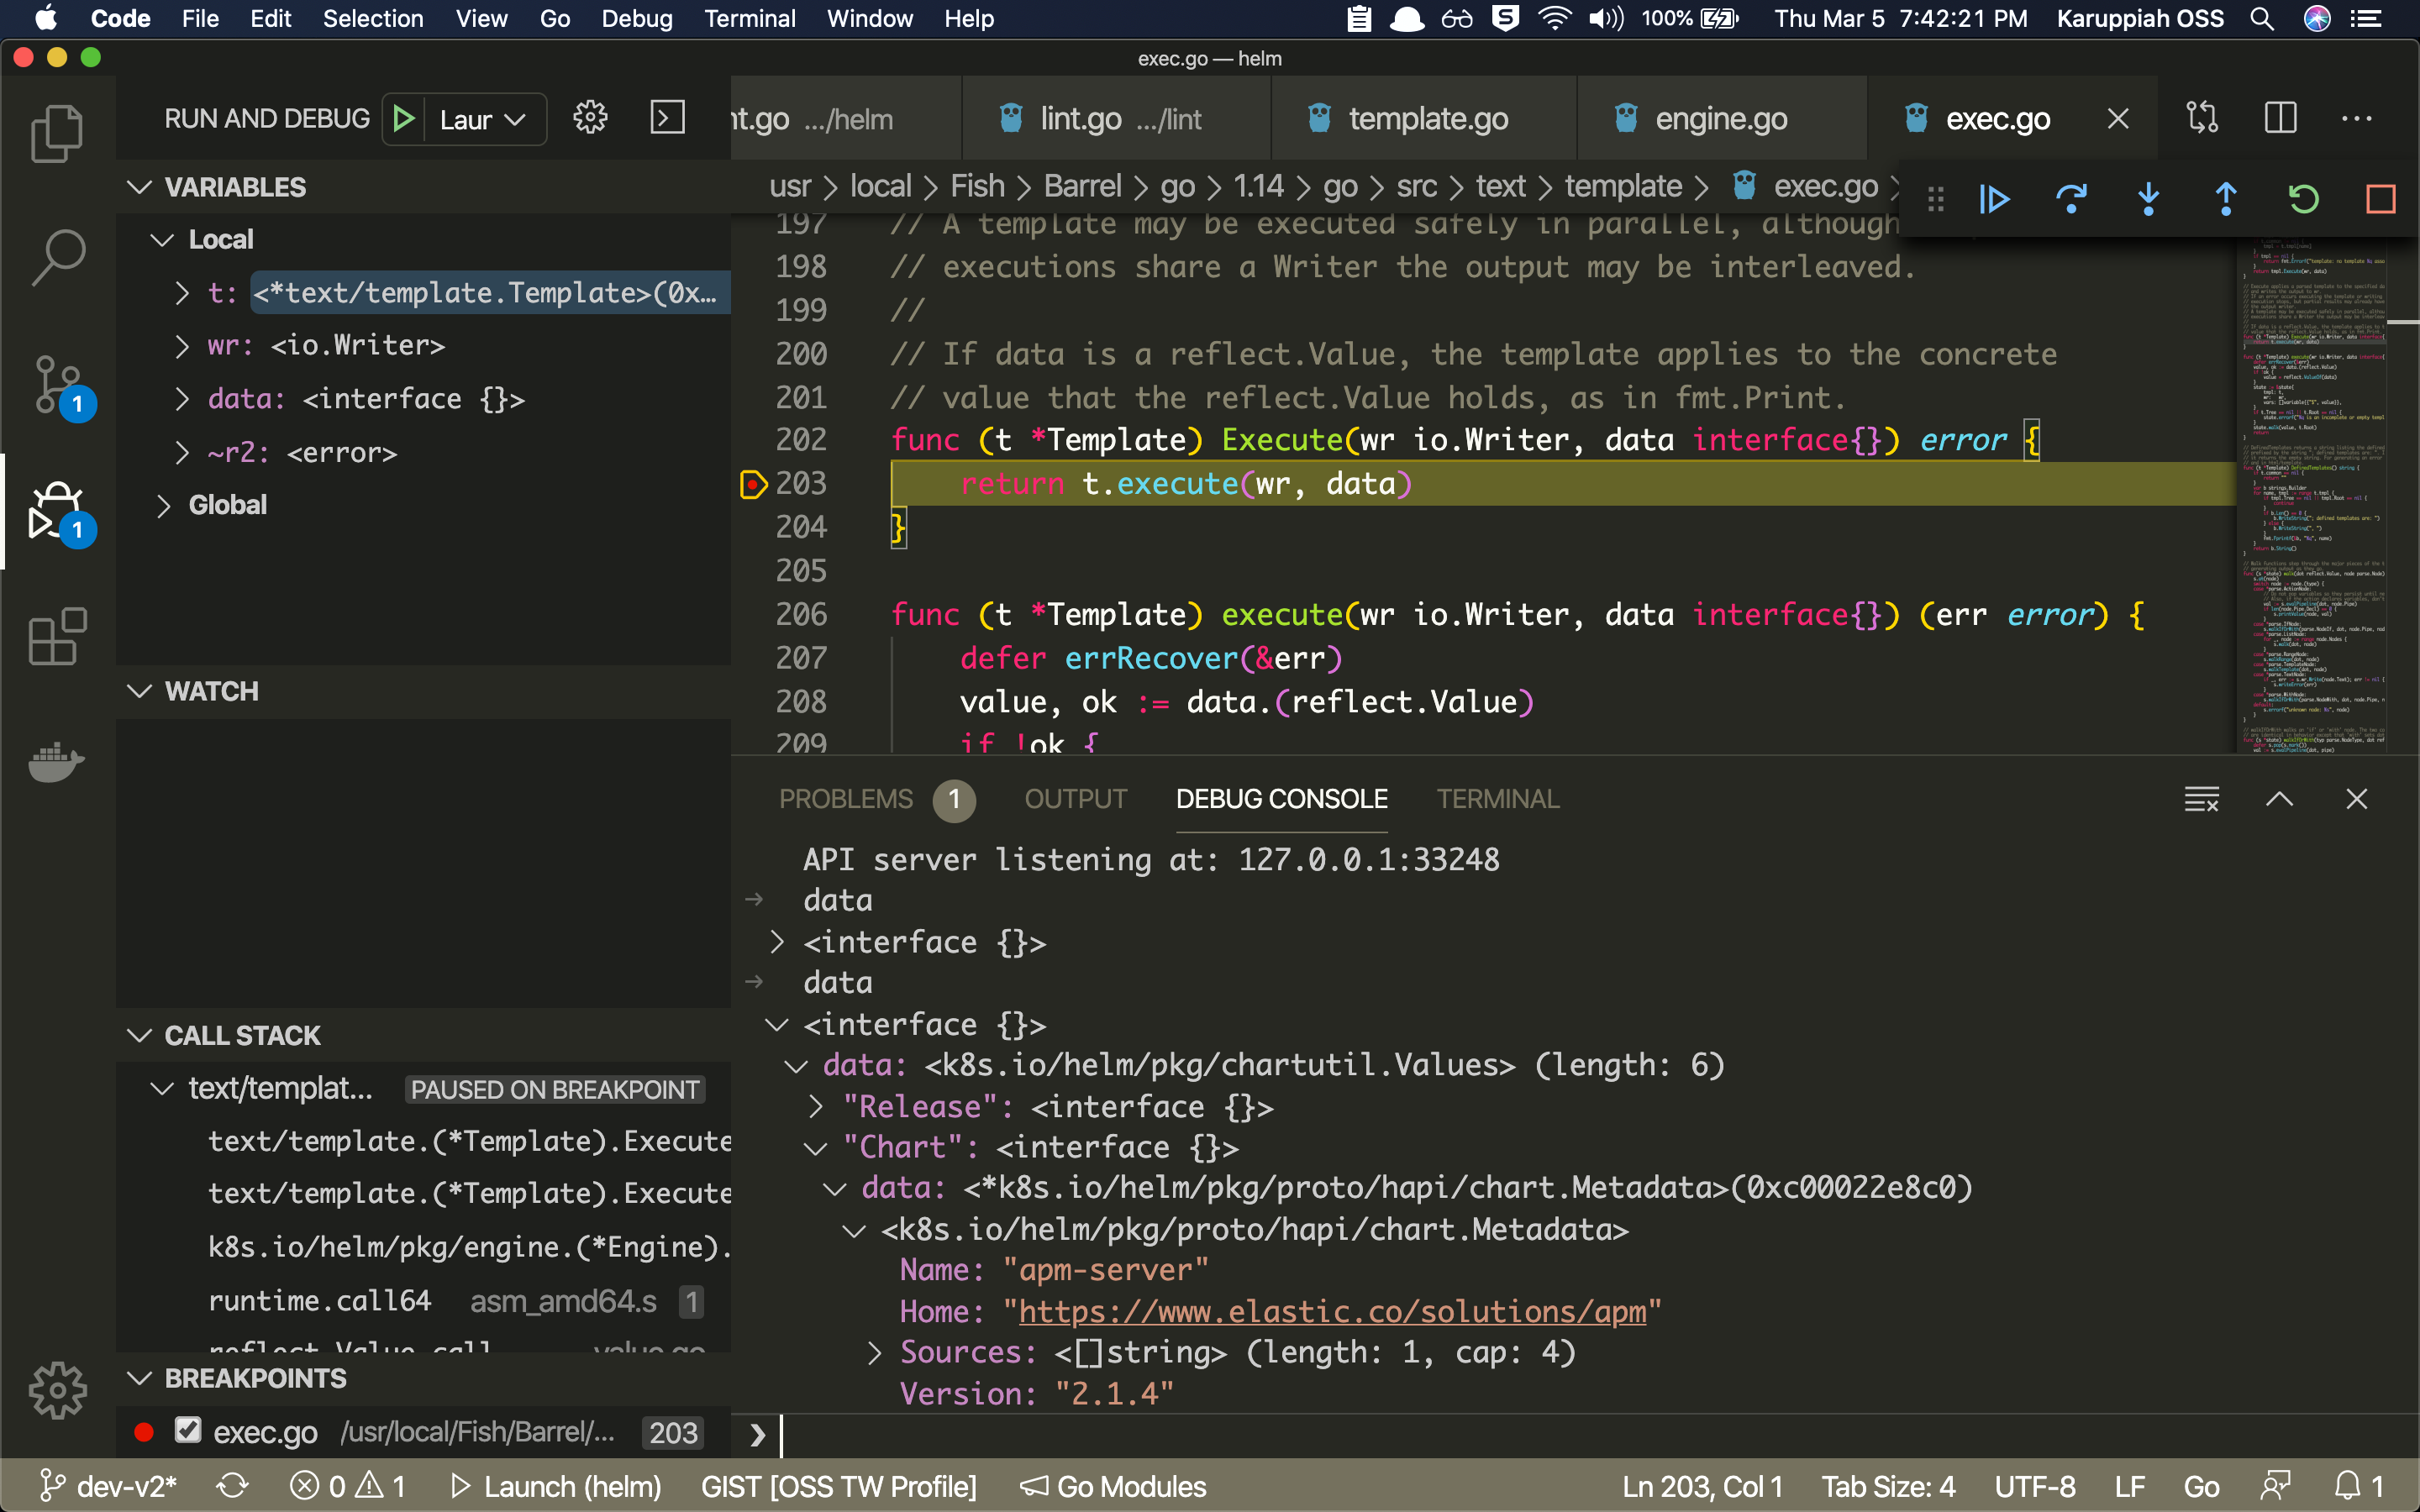
Look how I have also accessed the variable data in the console. You can also keep typing again and again in the console :P See below
You can also dig into the variable if it’s a struct or map, like this
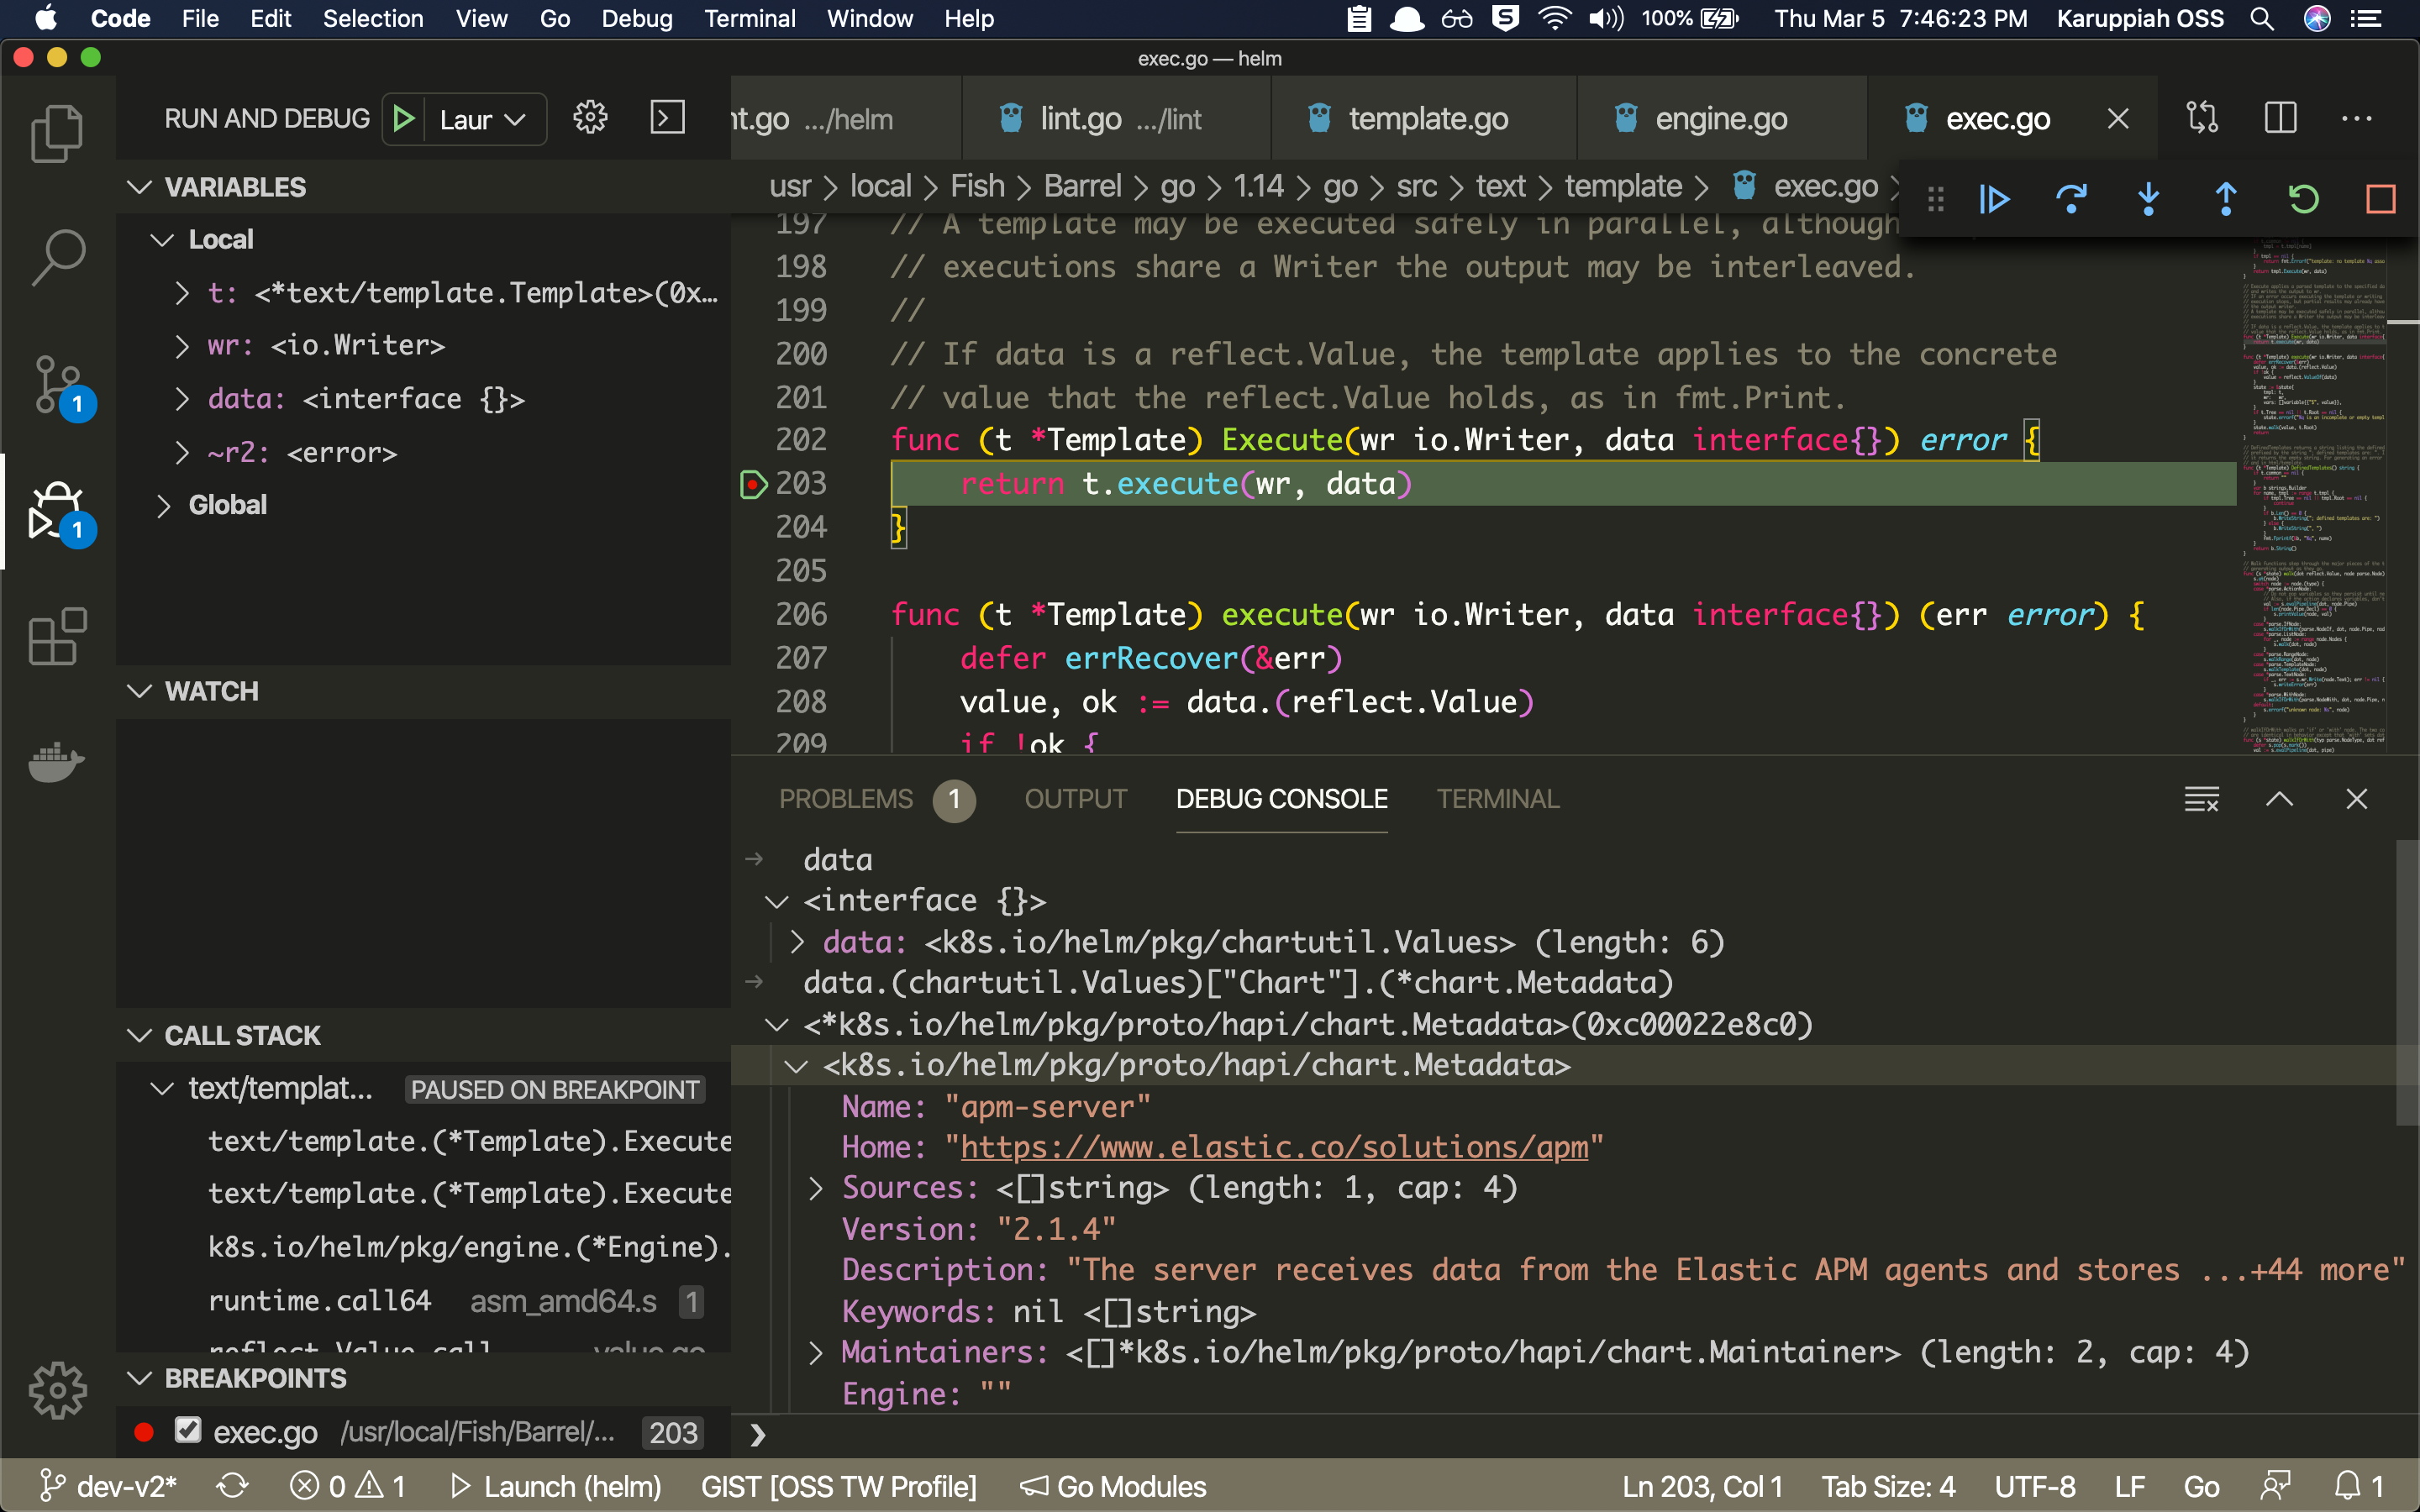
So, now you can get a single value in a variable with nested data types! :) See this -
Now, let’s say you can’t keep checking this single value and wait for it to change to some particular
value. What do you do? You can also add conditional breakpoints by right clicking on the breakpoint and
choosing Edit Breakpoint! You can also add breakpoint based on hit count, and also log messages when the
breakpoint is hit ;) :D See below to see how conditional breakpoint works. For others, I recommend
experimenting it yourself ;)
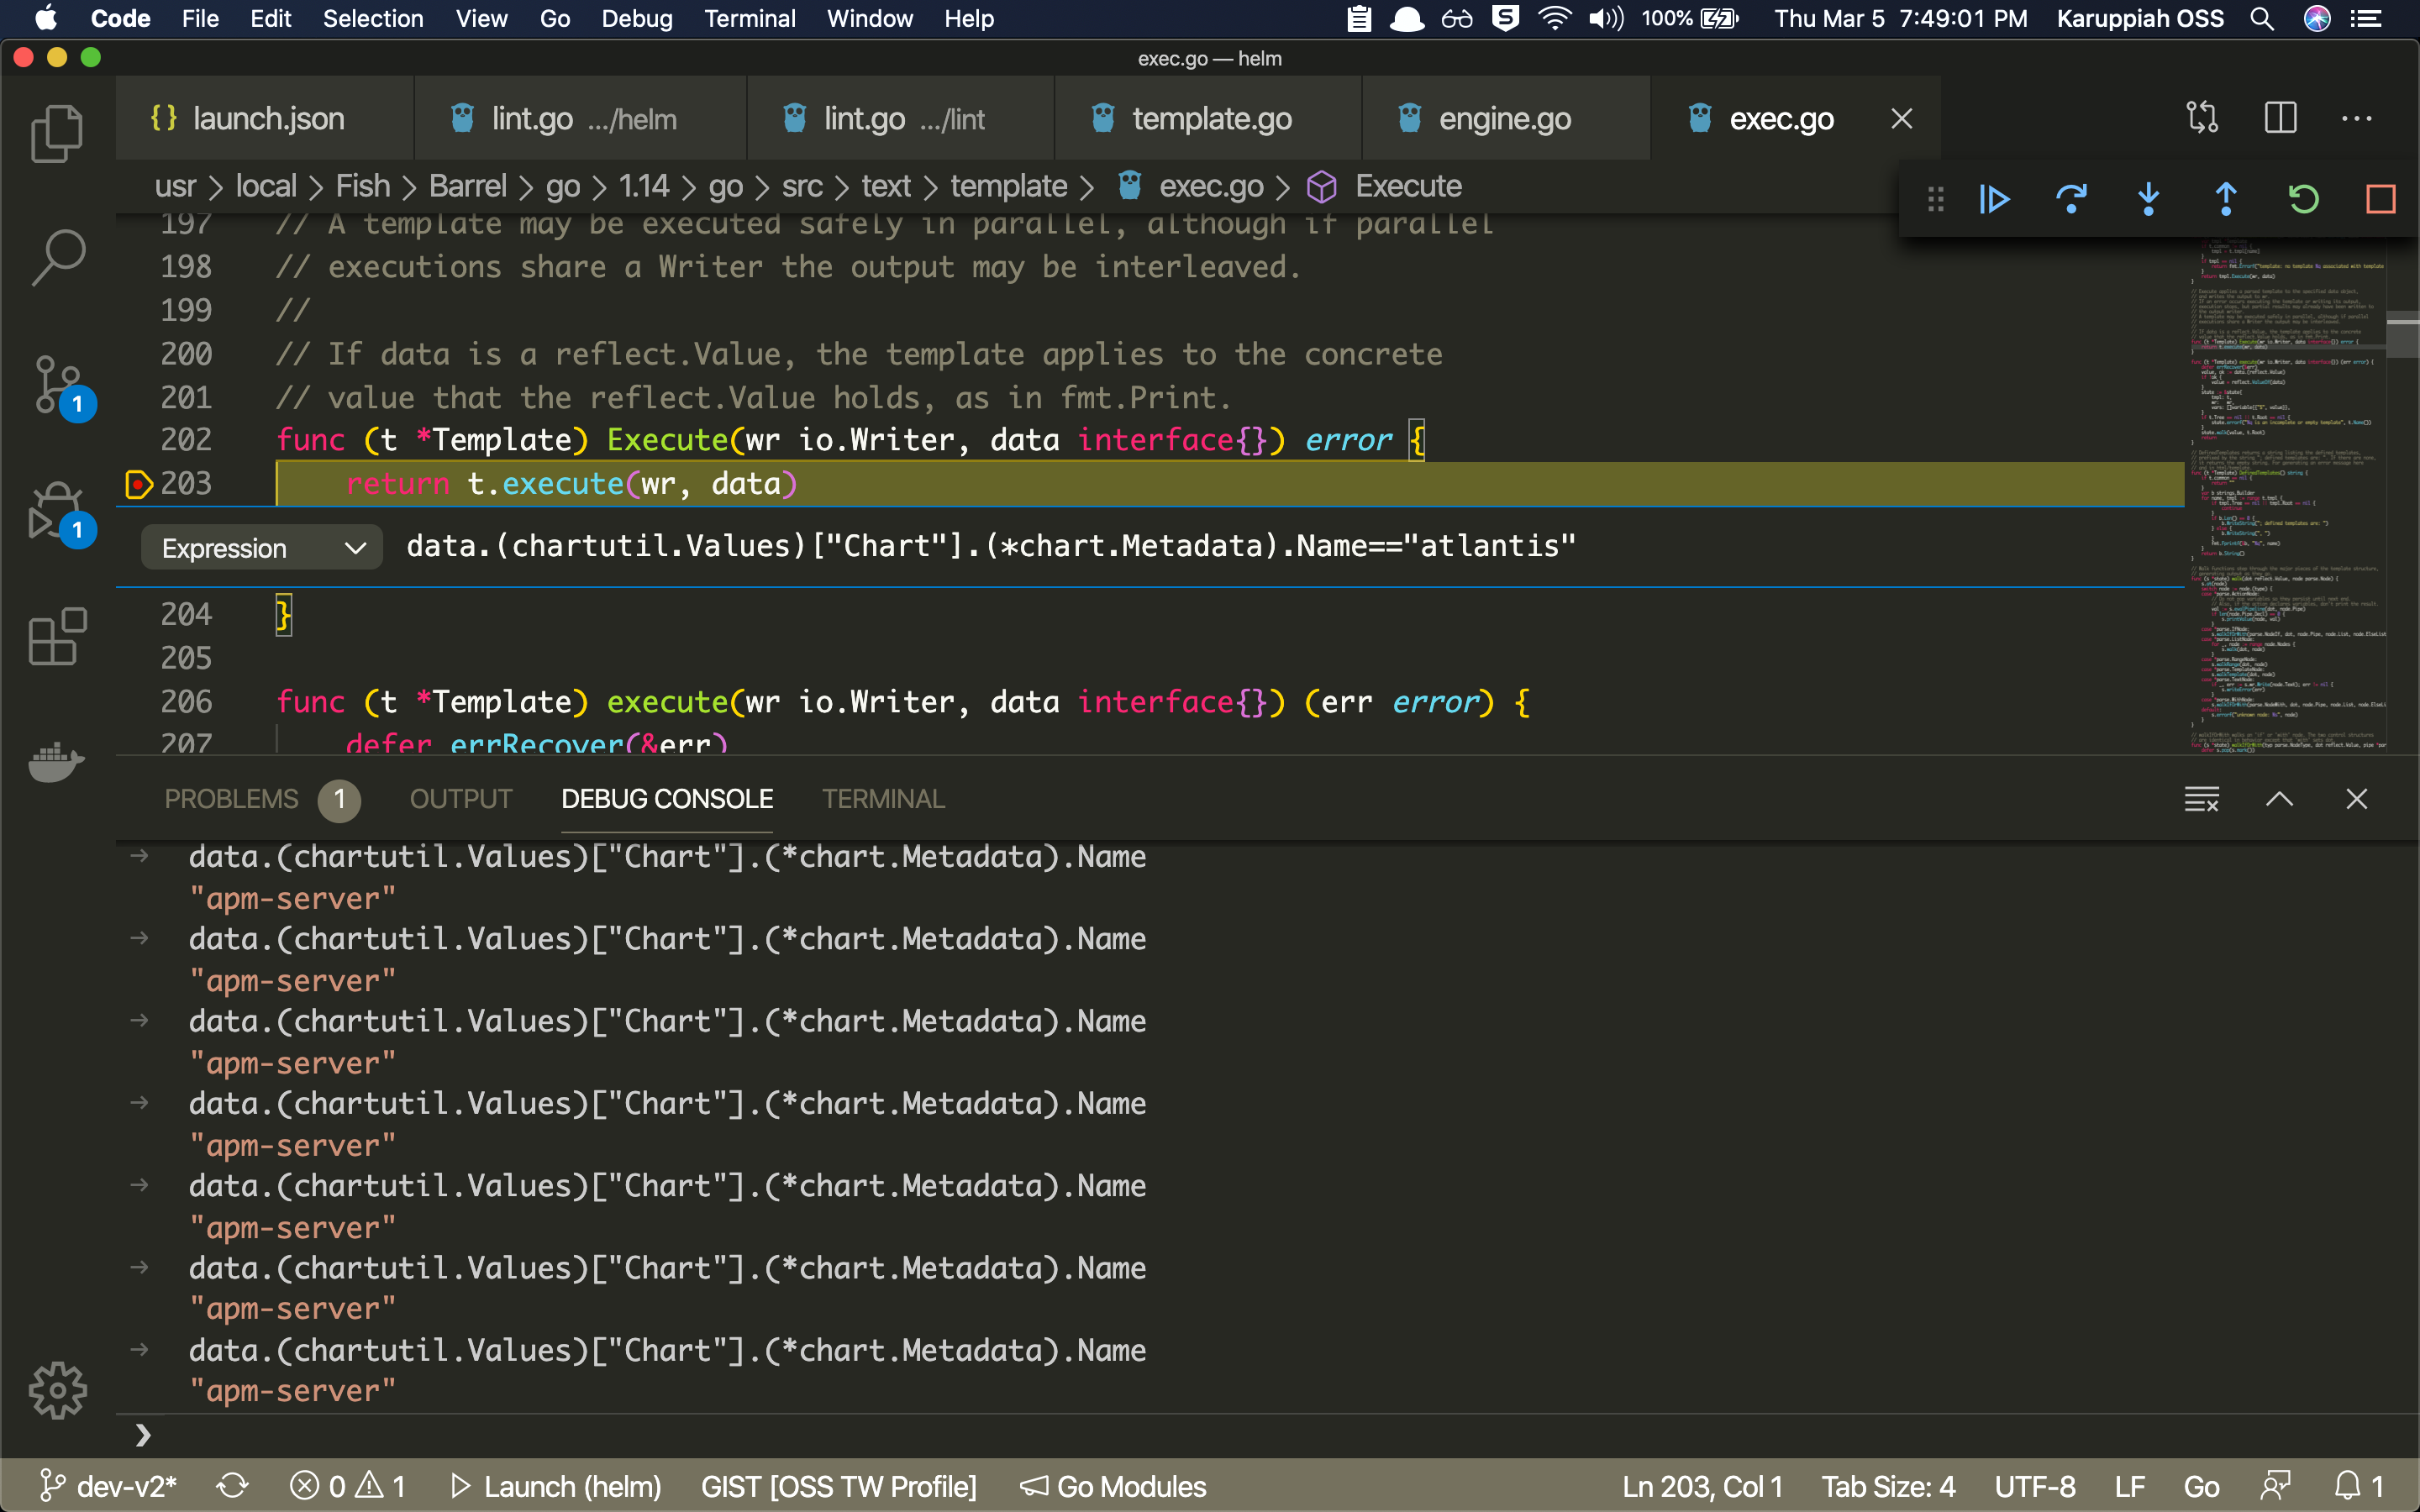
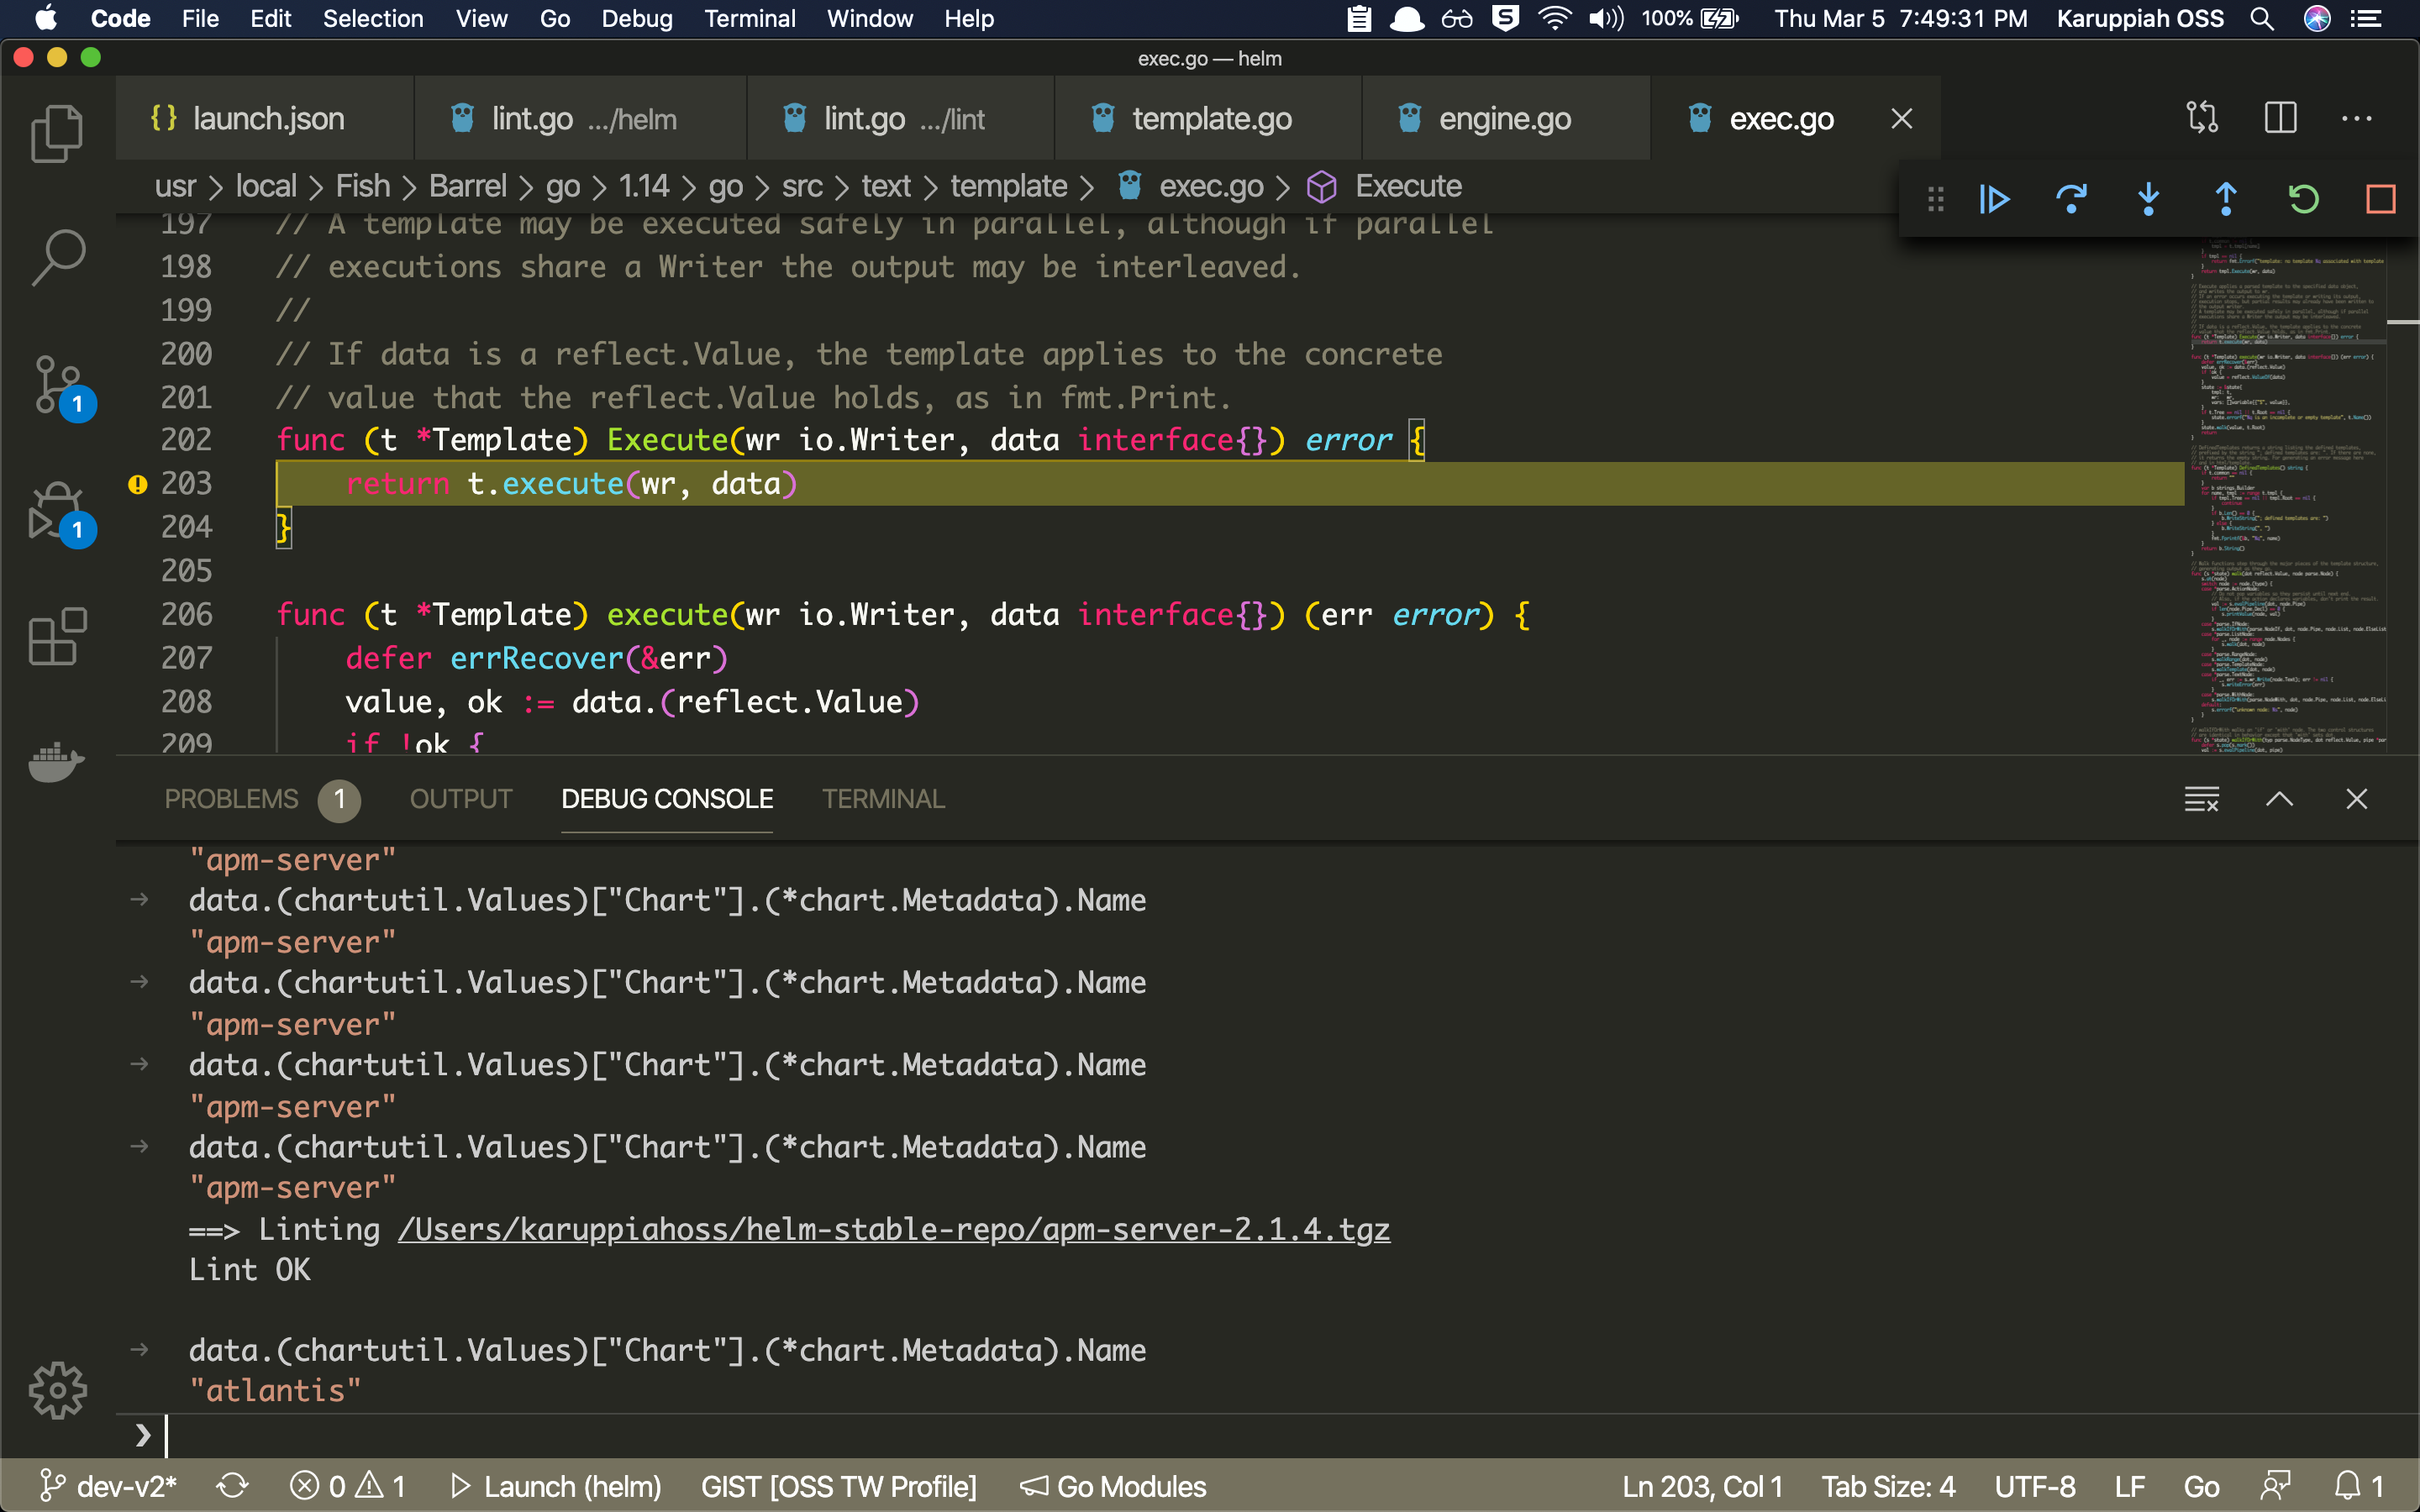
So, the expression I used is data.(chartutil.Values)["Chart"].(*chart.Metadata).Name=="atlantis". Now, you
can see below to see how the conditional breakpoint stops correctly when the expression is true. See the console to see how
the expression value is atlantis, which is a Helm Chart name for Atlantis
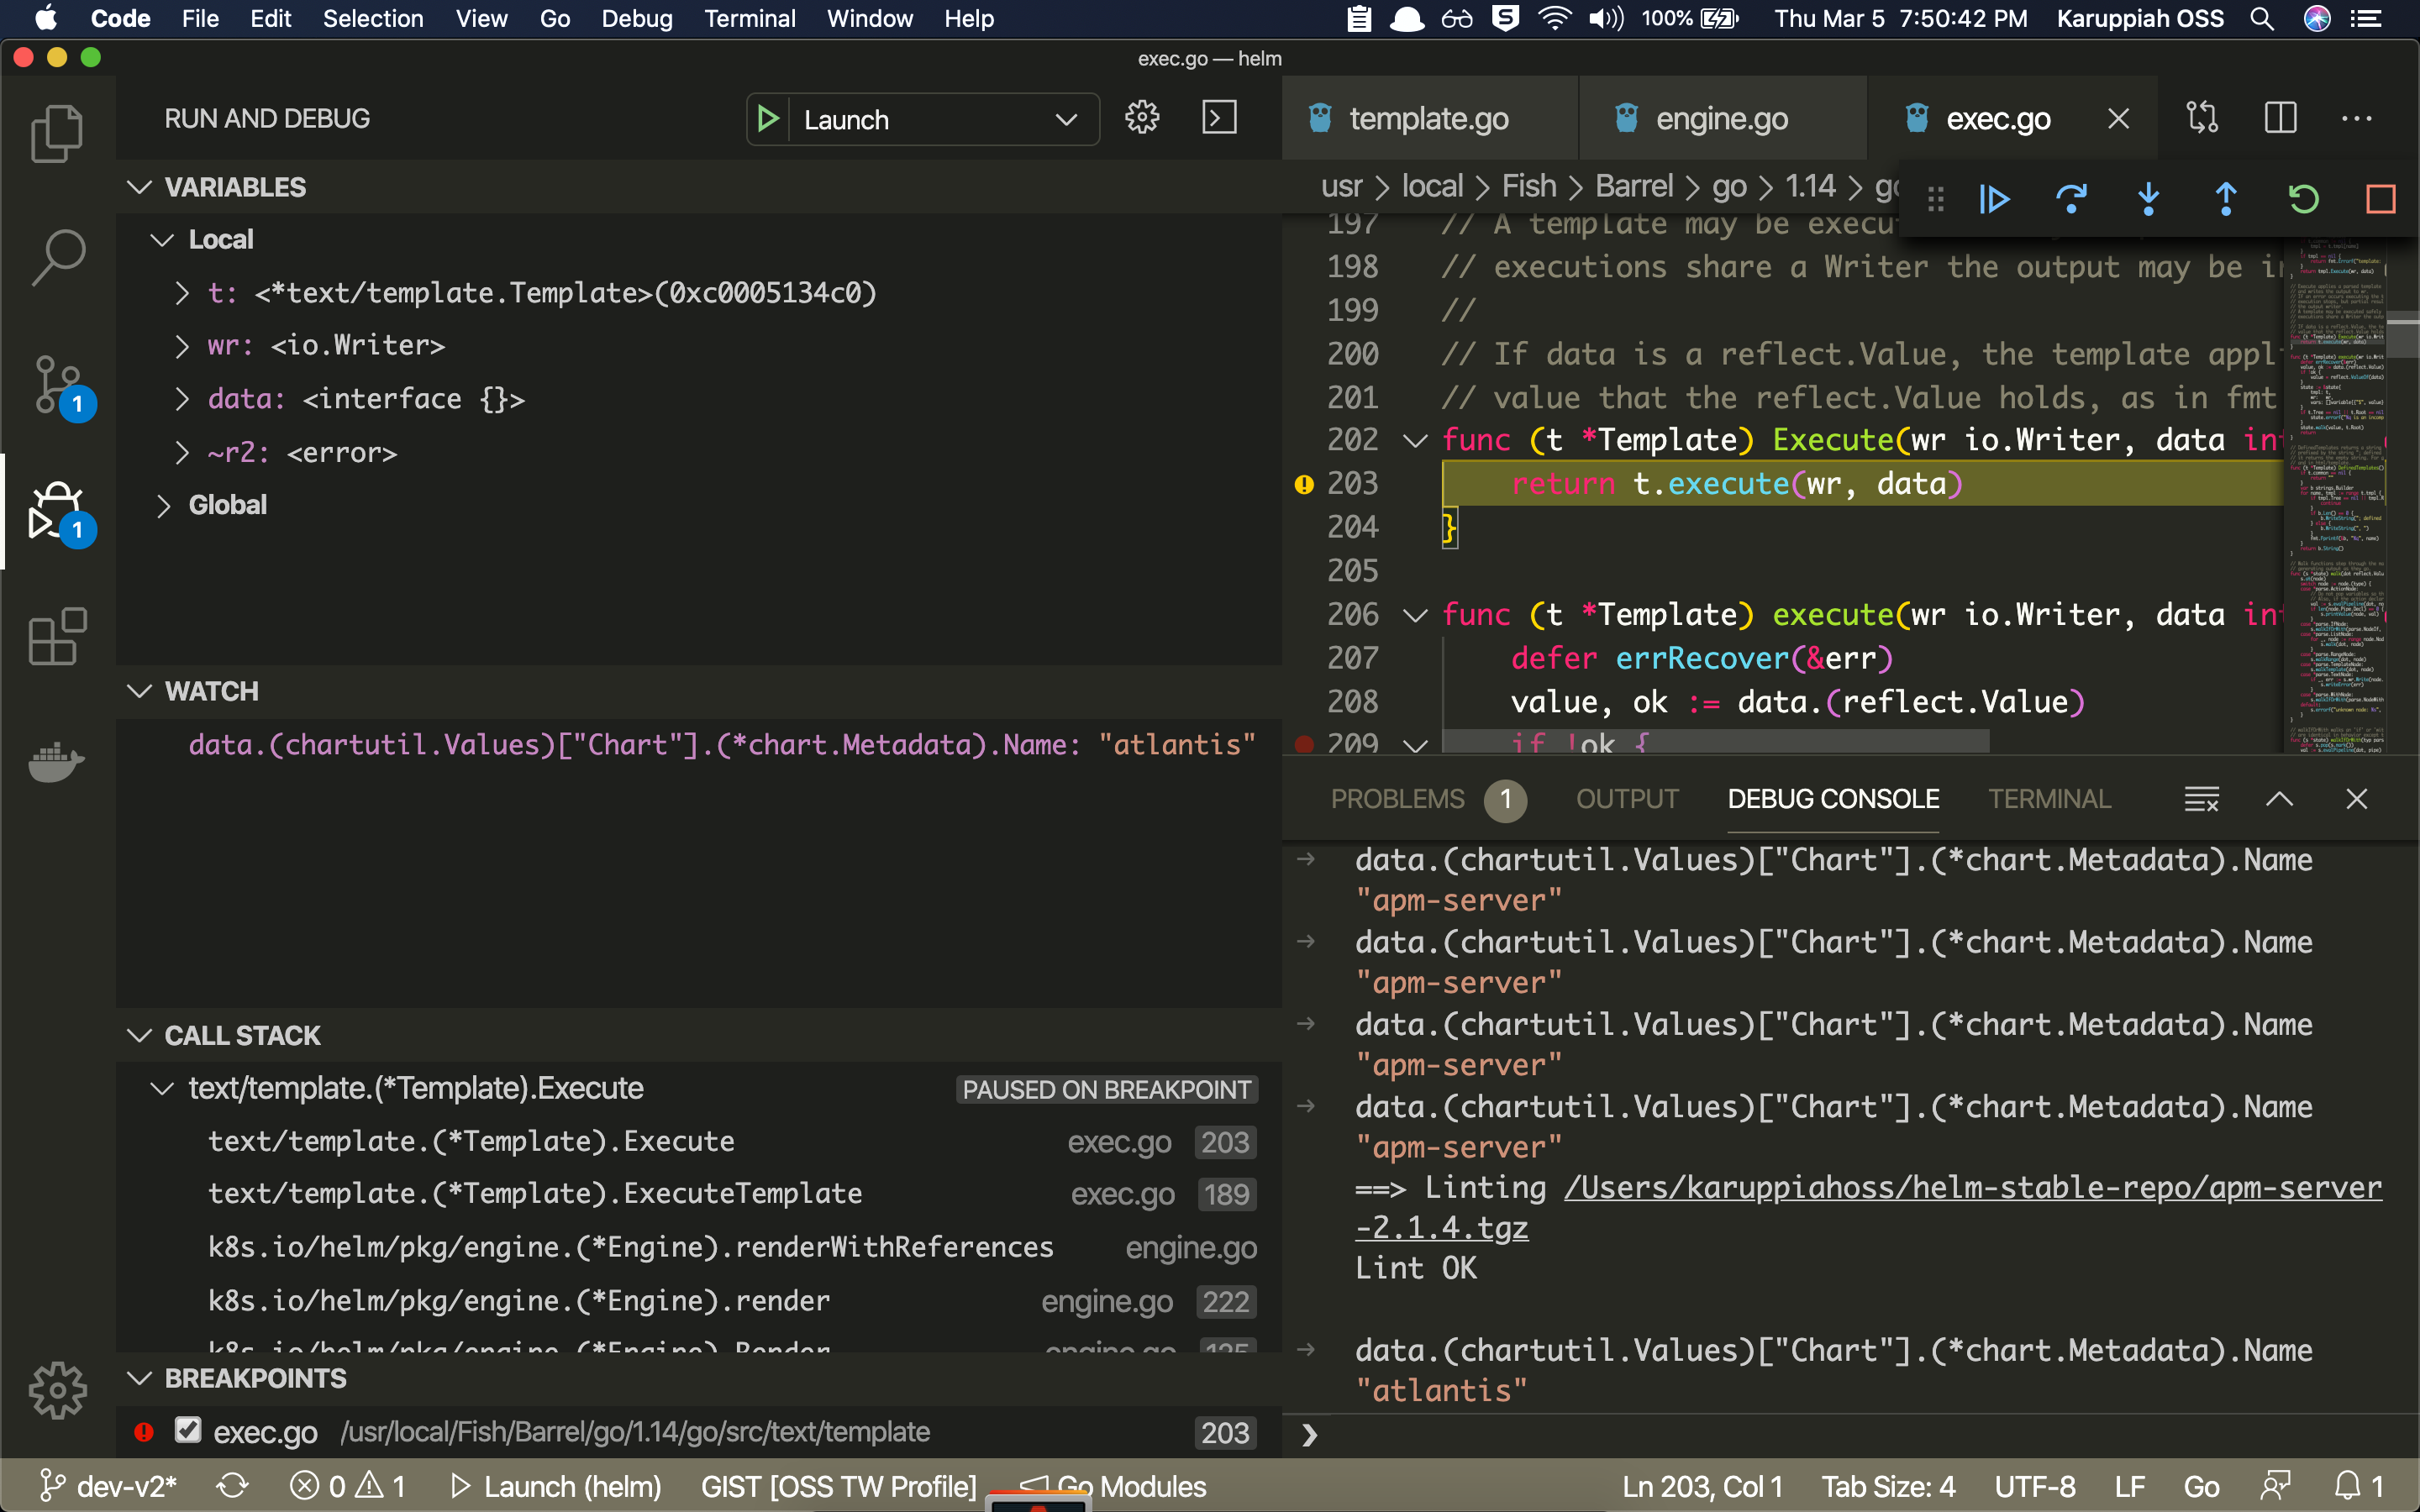
You can add some watches for values too! Here’s a screenshot for the same
So that’s how you debug a Go program. That’s all folks! If you have any questions shoot them below! 😄
Extra resource to read more on debugging and golang debugging in VS Code:
https://github.com/Microsoft/vscode-go/wiki/Debugging-Go-code-using-VS-Code
https://code.visualstudio.com/docs/editor/debugging#_launch-configurations
PS: This post was meant to be written last year, just after the Intellij golang debugging post. I finally finished it with the help of all the resources (screenshots) that I had got last year 🙈😅😂 Planned to reuse them, but then created some new screenshots and got one from the Internet too! :)
May be sometime I’ll record videos on how to debug too, using VS code :) ;)